
Research Writing and Analysis
- NVivo Group and Study Sessions
- SPSS This link opens in a new window
- Statistical Analysis Group sessions
- Using Qualtrics
- Dissertation and Data Analysis Group Sessions
- Defense Schedule - Commons Calendar This link opens in a new window
- Research Process Flow Chart
- Research Alignment Chapter 1 This link opens in a new window
- Step 1: Seek Out Evidence
- Step 2: Explain
- Step 3: The Big Picture
- Step 4: Own It
- Step 5: Illustrate
- Annotated Bibliography
- Literature Review This link opens in a new window
- Systematic Reviews & Meta-Analyses
- How to Synthesize and Analyze
- Synthesis and Analysis Practice
- Synthesis and Analysis Group Sessions
- Problem Statement
- Purpose Statement
- Conceptual Framework
- Theoretical Framework
- Locating Theoretical and Conceptual Frameworks This link opens in a new window
- Quantitative Research Questions
- Qualitative Research Questions
- Trustworthiness of Qualitative Data
- Analysis and Coding Example- Qualitative Data
- Thematic Data Analysis in Qualitative Design
- Dissertation to Journal Article This link opens in a new window
- International Journal of Online Graduate Education (IJOGE) This link opens in a new window
- Journal of Research in Innovative Teaching & Learning (JRIT&L) This link opens in a new window
Writing a Case Study

What is a case study?

A Case study is:
- An in-depth research design that primarily uses a qualitative methodology but sometimes includes quantitative methodology.
- Used to examine an identifiable problem confirmed through research.
- Used to investigate an individual, group of people, organization, or event.
- Used to mostly answer "how" and "why" questions.
What are the different types of case studies?

| Descriptive | This type of case study allows the researcher to: | How has the implementation and use of the instructional coaching intervention for elementary teachers impacted students’ attitudes toward reading? |
| Explanatory | This type of case study allows the researcher to: | Why do differences exist when implementing the same online reading curriculum in three elementary classrooms? |
| Exploratory | This type of case study allows the researcher to:
| What are potential barriers to student’s reading success when middle school teachers implement the Ready Reader curriculum online? |
| Multiple Case Studies or Collective Case Study | This type of case study allows the researcher to: | How are individual school districts addressing student engagement in an online classroom? |
| Intrinsic | This type of case study allows the researcher to: | How does a student’s familial background influence a teacher’s ability to provide meaningful instruction? |
| Instrumental | This type of case study allows the researcher to: | How a rural school district’s integration of a reward system maximized student engagement? |
Note: These are the primary case studies. As you continue to research and learn
about case studies you will begin to find a robust list of different types.
Who are your case study participants?

|
|
This type of study is implemented to understand an individual by developing a detailed explanation of the individual’s lived experiences or perceptions.
|
|
| This type of study is implemented to explore a particular group of people’s perceptions. |
|
| This type of study is implemented to explore the perspectives of people who work for or had interaction with a specific organization or company. |
|
| This type of study is implemented to explore participant’s perceptions of an event. |
What is triangulation ?
Validity and credibility are an essential part of the case study. Therefore, the researcher should include triangulation to ensure trustworthiness while accurately reflecting what the researcher seeks to investigate.

How to write a Case Study?
When developing a case study, there are different ways you could present the information, but remember to include the five parts for your case study.

|
|
|
|
|
|

Was this resource helpful?
- << Previous: Thematic Data Analysis in Qualitative Design
- Next: Journal Article Reporting Standards (JARS) >>
- Last Updated: Aug 16, 2024 10:43 AM
- URL: https://resources.nu.edu/researchtools

Case Study vs. Survey
What's the difference.
Case studies and surveys are both research methods used in various fields to gather information and insights. However, they differ in their approach and purpose. A case study involves an in-depth analysis of a specific individual, group, or situation, aiming to understand the complexities and unique aspects of the subject. It often involves collecting qualitative data through interviews, observations, and document analysis. On the other hand, a survey is a structured data collection method that involves gathering information from a larger sample size through standardized questionnaires. Surveys are typically used to collect quantitative data and provide a broader perspective on a particular topic or population. While case studies provide rich and detailed information, surveys offer a more generalizable and statistical overview.
| Attribute | Case Study | Survey |
|---|---|---|
| Research Method | Qualitative | Quantitative |
| Data Collection | Observations, interviews, documents | Questionnaires, interviews |
| Sample Size | Small | Large |
| Generalizability | Low | High |
| Depth of Analysis | High | Low |
| Time Required | Long | Short |
| Cost | High | Low |
| Flexibility | High | Low |
Further Detail
Introduction.
When conducting research, there are various methods available to gather data and analyze it. Two commonly used methods are case study and survey. Both approaches have their own unique attributes and can be valuable in different research contexts. In this article, we will explore the characteristics of case study and survey, highlighting their strengths and limitations.
A case study is an in-depth investigation of a particular individual, group, or phenomenon. It involves collecting detailed information about the subject of study through various sources such as interviews, observations, and document analysis. Case studies are often used in social sciences, psychology, and business research to gain a deep understanding of complex issues.
One of the key attributes of a case study is its ability to provide rich and detailed data. Researchers can gather extensive information about the subject, including their background, experiences, and perspectives. This depth of data allows for a comprehensive analysis and interpretation of the case, providing valuable insights into the phenomenon under investigation.
Furthermore, case studies are particularly useful when studying rare or unique cases. Since case studies focus on specific individuals or groups, they can shed light on situations that are not easily replicated or observed in larger populations. This makes case studies valuable in exploring complex and nuanced phenomena that may not be easily captured through other research methods.
However, it is important to note that case studies have certain limitations. Due to their in-depth nature, case studies are often time-consuming and resource-intensive. Researchers need to invest significant effort in data collection, analysis, and interpretation. Additionally, the findings of a case study may not be easily generalized to larger populations, as the focus is on a specific case rather than a representative sample.
Despite these limitations, case studies offer a unique opportunity to explore complex issues in real-life contexts. They provide a detailed understanding of individual experiences and can generate hypotheses for further research.
A survey is a research method that involves collecting data from a sample of individuals through a structured questionnaire or interview. Surveys are widely used in social sciences, market research, and public opinion studies to gather information about a larger population. They aim to provide a snapshot of people's opinions, attitudes, behaviors, or characteristics.
One of the main advantages of surveys is their ability to collect data from a large number of respondents. By reaching out to a representative sample, researchers can generalize the findings to a larger population. Surveys also allow for efficient data collection, as questionnaires can be distributed electronically or in person, making it easier to gather a wide range of responses in a relatively short period.
Moreover, surveys offer a structured approach to data collection, ensuring consistency in the questions asked and the response options provided. This allows for easy comparison and analysis of the data, making surveys suitable for quantitative research. Surveys can also be conducted anonymously, which can encourage respondents to provide honest and unbiased answers, particularly when sensitive topics are being explored.
However, surveys also have their limitations. One of the challenges is the potential for response bias. Respondents may provide inaccurate or socially desirable answers, leading to biased results. Additionally, surveys often rely on self-reported data, which may be subject to memory recall errors or misinterpretation of questions. Researchers need to carefully design the survey instrument and consider potential biases to ensure the validity and reliability of the data collected.
Furthermore, surveys may not capture the complexity and depth of individual experiences. They provide a snapshot of people's opinions or behaviors at a specific point in time, but may not uncover the underlying reasons or motivations behind those responses. Surveys also rely on predetermined response options, limiting the range of possible answers and potentially overlooking important nuances.
Case studies and surveys are both valuable research methods, each with its own strengths and limitations. Case studies offer in-depth insights into specific cases, providing rich and detailed data. They are particularly useful for exploring complex and unique phenomena. On the other hand, surveys allow for efficient data collection from a large number of respondents, enabling generalization to larger populations. They provide structured and quantifiable data, making them suitable for statistical analysis.
Ultimately, the choice between case study and survey depends on the research objectives, the nature of the research question, and the available resources. Researchers need to carefully consider the attributes of each method and select the most appropriate approach to gather and analyze data effectively.
Comparisons may contain inaccurate information about people, places, or facts. Please report any issues.

The Ultimate Guide to Qualitative Research - Part 1: The Basics

- Introduction and overview
- What is qualitative research?
- What is qualitative data?
- Examples of qualitative data
- Qualitative vs. quantitative research
- Mixed methods
- Qualitative research preparation
- Theoretical perspective
- Theoretical framework
- Literature reviews
Research question
- Conceptual framework
- Conceptual vs. theoretical framework
Data collection
- Qualitative research methods
- Focus groups
- Observational research
What is a case study?
Applications for case study research, what is a good case study, process of case study design, benefits and limitations of case studies.
- Ethnographical research
- Ethical considerations
- Confidentiality and privacy
- Power dynamics
- Reflexivity
Case studies
Case studies are essential to qualitative research , offering a lens through which researchers can investigate complex phenomena within their real-life contexts. This chapter explores the concept, purpose, applications, examples, and types of case studies and provides guidance on how to conduct case study research effectively.

Whereas quantitative methods look at phenomena at scale, case study research looks at a concept or phenomenon in considerable detail. While analyzing a single case can help understand one perspective regarding the object of research inquiry, analyzing multiple cases can help obtain a more holistic sense of the topic or issue. Let's provide a basic definition of a case study, then explore its characteristics and role in the qualitative research process.
Definition of a case study
A case study in qualitative research is a strategy of inquiry that involves an in-depth investigation of a phenomenon within its real-world context. It provides researchers with the opportunity to acquire an in-depth understanding of intricate details that might not be as apparent or accessible through other methods of research. The specific case or cases being studied can be a single person, group, or organization – demarcating what constitutes a relevant case worth studying depends on the researcher and their research question .
Among qualitative research methods , a case study relies on multiple sources of evidence, such as documents, artifacts, interviews , or observations , to present a complete and nuanced understanding of the phenomenon under investigation. The objective is to illuminate the readers' understanding of the phenomenon beyond its abstract statistical or theoretical explanations.
Characteristics of case studies
Case studies typically possess a number of distinct characteristics that set them apart from other research methods. These characteristics include a focus on holistic description and explanation, flexibility in the design and data collection methods, reliance on multiple sources of evidence, and emphasis on the context in which the phenomenon occurs.
Furthermore, case studies can often involve a longitudinal examination of the case, meaning they study the case over a period of time. These characteristics allow case studies to yield comprehensive, in-depth, and richly contextualized insights about the phenomenon of interest.
The role of case studies in research
Case studies hold a unique position in the broader landscape of research methods aimed at theory development. They are instrumental when the primary research interest is to gain an intensive, detailed understanding of a phenomenon in its real-life context.
In addition, case studies can serve different purposes within research - they can be used for exploratory, descriptive, or explanatory purposes, depending on the research question and objectives. This flexibility and depth make case studies a valuable tool in the toolkit of qualitative researchers.
Remember, a well-conducted case study can offer a rich, insightful contribution to both academic and practical knowledge through theory development or theory verification, thus enhancing our understanding of complex phenomena in their real-world contexts.
What is the purpose of a case study?
Case study research aims for a more comprehensive understanding of phenomena, requiring various research methods to gather information for qualitative analysis . Ultimately, a case study can allow the researcher to gain insight into a particular object of inquiry and develop a theoretical framework relevant to the research inquiry.
Why use case studies in qualitative research?
Using case studies as a research strategy depends mainly on the nature of the research question and the researcher's access to the data.
Conducting case study research provides a level of detail and contextual richness that other research methods might not offer. They are beneficial when there's a need to understand complex social phenomena within their natural contexts.
The explanatory, exploratory, and descriptive roles of case studies
Case studies can take on various roles depending on the research objectives. They can be exploratory when the research aims to discover new phenomena or define new research questions; they are descriptive when the objective is to depict a phenomenon within its context in a detailed manner; and they can be explanatory if the goal is to understand specific relationships within the studied context. Thus, the versatility of case studies allows researchers to approach their topic from different angles, offering multiple ways to uncover and interpret the data .
The impact of case studies on knowledge development
Case studies play a significant role in knowledge development across various disciplines. Analysis of cases provides an avenue for researchers to explore phenomena within their context based on the collected data.

This can result in the production of rich, practical insights that can be instrumental in both theory-building and practice. Case studies allow researchers to delve into the intricacies and complexities of real-life situations, uncovering insights that might otherwise remain hidden.
Types of case studies
In qualitative research , a case study is not a one-size-fits-all approach. Depending on the nature of the research question and the specific objectives of the study, researchers might choose to use different types of case studies. These types differ in their focus, methodology, and the level of detail they provide about the phenomenon under investigation.
Understanding these types is crucial for selecting the most appropriate approach for your research project and effectively achieving your research goals. Let's briefly look at the main types of case studies.
Exploratory case studies
Exploratory case studies are typically conducted to develop a theory or framework around an understudied phenomenon. They can also serve as a precursor to a larger-scale research project. Exploratory case studies are useful when a researcher wants to identify the key issues or questions which can spur more extensive study or be used to develop propositions for further research. These case studies are characterized by flexibility, allowing researchers to explore various aspects of a phenomenon as they emerge, which can also form the foundation for subsequent studies.
Descriptive case studies
Descriptive case studies aim to provide a complete and accurate representation of a phenomenon or event within its context. These case studies are often based on an established theoretical framework, which guides how data is collected and analyzed. The researcher is concerned with describing the phenomenon in detail, as it occurs naturally, without trying to influence or manipulate it.
Explanatory case studies
Explanatory case studies are focused on explanation - they seek to clarify how or why certain phenomena occur. Often used in complex, real-life situations, they can be particularly valuable in clarifying causal relationships among concepts and understanding the interplay between different factors within a specific context.

Intrinsic, instrumental, and collective case studies
These three categories of case studies focus on the nature and purpose of the study. An intrinsic case study is conducted when a researcher has an inherent interest in the case itself. Instrumental case studies are employed when the case is used to provide insight into a particular issue or phenomenon. A collective case study, on the other hand, involves studying multiple cases simultaneously to investigate some general phenomena.
Each type of case study serves a different purpose and has its own strengths and challenges. The selection of the type should be guided by the research question and objectives, as well as the context and constraints of the research.
The flexibility, depth, and contextual richness offered by case studies make this approach an excellent research method for various fields of study. They enable researchers to investigate real-world phenomena within their specific contexts, capturing nuances that other research methods might miss. Across numerous fields, case studies provide valuable insights into complex issues.
Critical information systems research
Case studies provide a detailed understanding of the role and impact of information systems in different contexts. They offer a platform to explore how information systems are designed, implemented, and used and how they interact with various social, economic, and political factors. Case studies in this field often focus on examining the intricate relationship between technology, organizational processes, and user behavior, helping to uncover insights that can inform better system design and implementation.
Health research
Health research is another field where case studies are highly valuable. They offer a way to explore patient experiences, healthcare delivery processes, and the impact of various interventions in a real-world context.

Case studies can provide a deep understanding of a patient's journey, giving insights into the intricacies of disease progression, treatment effects, and the psychosocial aspects of health and illness.
Asthma research studies
Specifically within medical research, studies on asthma often employ case studies to explore the individual and environmental factors that influence asthma development, management, and outcomes. A case study can provide rich, detailed data about individual patients' experiences, from the triggers and symptoms they experience to the effectiveness of various management strategies. This can be crucial for developing patient-centered asthma care approaches.
Other fields
Apart from the fields mentioned, case studies are also extensively used in business and management research, education research, and political sciences, among many others. They provide an opportunity to delve into the intricacies of real-world situations, allowing for a comprehensive understanding of various phenomena.
Case studies, with their depth and contextual focus, offer unique insights across these varied fields. They allow researchers to illuminate the complexities of real-life situations, contributing to both theory and practice.

Whatever field you're in, ATLAS.ti puts your data to work for you
Download a free trial of ATLAS.ti to turn your data into insights.
Understanding the key elements of case study design is crucial for conducting rigorous and impactful case study research. A well-structured design guides the researcher through the process, ensuring that the study is methodologically sound and its findings are reliable and valid. The main elements of case study design include the research question , propositions, units of analysis, and the logic linking the data to the propositions.
The research question is the foundation of any research study. A good research question guides the direction of the study and informs the selection of the case, the methods of collecting data, and the analysis techniques. A well-formulated research question in case study research is typically clear, focused, and complex enough to merit further detailed examination of the relevant case(s).
Propositions
Propositions, though not necessary in every case study, provide a direction by stating what we might expect to find in the data collected. They guide how data is collected and analyzed by helping researchers focus on specific aspects of the case. They are particularly important in explanatory case studies, which seek to understand the relationships among concepts within the studied phenomenon.
Units of analysis
The unit of analysis refers to the case, or the main entity or entities that are being analyzed in the study. In case study research, the unit of analysis can be an individual, a group, an organization, a decision, an event, or even a time period. It's crucial to clearly define the unit of analysis, as it shapes the qualitative data analysis process by allowing the researcher to analyze a particular case and synthesize analysis across multiple case studies to draw conclusions.
Argumentation
This refers to the inferential model that allows researchers to draw conclusions from the data. The researcher needs to ensure that there is a clear link between the data, the propositions (if any), and the conclusions drawn. This argumentation is what enables the researcher to make valid and credible inferences about the phenomenon under study.
Understanding and carefully considering these elements in the design phase of a case study can significantly enhance the quality of the research. It can help ensure that the study is methodologically sound and its findings contribute meaningful insights about the case.
Ready to jumpstart your research with ATLAS.ti?
Conceptualize your research project with our intuitive data analysis interface. Download a free trial today.
Conducting a case study involves several steps, from defining the research question and selecting the case to collecting and analyzing data . This section outlines these key stages, providing a practical guide on how to conduct case study research.
Defining the research question
The first step in case study research is defining a clear, focused research question. This question should guide the entire research process, from case selection to analysis. It's crucial to ensure that the research question is suitable for a case study approach. Typically, such questions are exploratory or descriptive in nature and focus on understanding a phenomenon within its real-life context.
Selecting and defining the case
The selection of the case should be based on the research question and the objectives of the study. It involves choosing a unique example or a set of examples that provide rich, in-depth data about the phenomenon under investigation. After selecting the case, it's crucial to define it clearly, setting the boundaries of the case, including the time period and the specific context.
Previous research can help guide the case study design. When considering a case study, an example of a case could be taken from previous case study research and used to define cases in a new research inquiry. Considering recently published examples can help understand how to select and define cases effectively.
Developing a detailed case study protocol
A case study protocol outlines the procedures and general rules to be followed during the case study. This includes the data collection methods to be used, the sources of data, and the procedures for analysis. Having a detailed case study protocol ensures consistency and reliability in the study.
The protocol should also consider how to work with the people involved in the research context to grant the research team access to collecting data. As mentioned in previous sections of this guide, establishing rapport is an essential component of qualitative research as it shapes the overall potential for collecting and analyzing data.
Collecting data
Gathering data in case study research often involves multiple sources of evidence, including documents, archival records, interviews, observations, and physical artifacts. This allows for a comprehensive understanding of the case. The process for gathering data should be systematic and carefully documented to ensure the reliability and validity of the study.
Analyzing and interpreting data
The next step is analyzing the data. This involves organizing the data , categorizing it into themes or patterns , and interpreting these patterns to answer the research question. The analysis might also involve comparing the findings with prior research or theoretical propositions.
Writing the case study report
The final step is writing the case study report . This should provide a detailed description of the case, the data, the analysis process, and the findings. The report should be clear, organized, and carefully written to ensure that the reader can understand the case and the conclusions drawn from it.
Each of these steps is crucial in ensuring that the case study research is rigorous, reliable, and provides valuable insights about the case.
The type, depth, and quality of data in your study can significantly influence the validity and utility of the study. In case study research, data is usually collected from multiple sources to provide a comprehensive and nuanced understanding of the case. This section will outline the various methods of collecting data used in case study research and discuss considerations for ensuring the quality of the data.
Interviews are a common method of gathering data in case study research. They can provide rich, in-depth data about the perspectives, experiences, and interpretations of the individuals involved in the case. Interviews can be structured , semi-structured , or unstructured , depending on the research question and the degree of flexibility needed.
Observations
Observations involve the researcher observing the case in its natural setting, providing first-hand information about the case and its context. Observations can provide data that might not be revealed in interviews or documents, such as non-verbal cues or contextual information.
Documents and artifacts
Documents and archival records provide a valuable source of data in case study research. They can include reports, letters, memos, meeting minutes, email correspondence, and various public and private documents related to the case.

These records can provide historical context, corroborate evidence from other sources, and offer insights into the case that might not be apparent from interviews or observations.
Physical artifacts refer to any physical evidence related to the case, such as tools, products, or physical environments. These artifacts can provide tangible insights into the case, complementing the data gathered from other sources.
Ensuring the quality of data collection
Determining the quality of data in case study research requires careful planning and execution. It's crucial to ensure that the data is reliable, accurate, and relevant to the research question. This involves selecting appropriate methods of collecting data, properly training interviewers or observers, and systematically recording and storing the data. It also includes considering ethical issues related to collecting and handling data, such as obtaining informed consent and ensuring the privacy and confidentiality of the participants.
Data analysis
Analyzing case study research involves making sense of the rich, detailed data to answer the research question. This process can be challenging due to the volume and complexity of case study data. However, a systematic and rigorous approach to analysis can ensure that the findings are credible and meaningful. This section outlines the main steps and considerations in analyzing data in case study research.
Organizing the data
The first step in the analysis is organizing the data. This involves sorting the data into manageable sections, often according to the data source or the theme. This step can also involve transcribing interviews, digitizing physical artifacts, or organizing observational data.
Categorizing and coding the data
Once the data is organized, the next step is to categorize or code the data. This involves identifying common themes, patterns, or concepts in the data and assigning codes to relevant data segments. Coding can be done manually or with the help of software tools, and in either case, qualitative analysis software can greatly facilitate the entire coding process. Coding helps to reduce the data to a set of themes or categories that can be more easily analyzed.
Identifying patterns and themes
After coding the data, the researcher looks for patterns or themes in the coded data. This involves comparing and contrasting the codes and looking for relationships or patterns among them. The identified patterns and themes should help answer the research question.
Interpreting the data
Once patterns and themes have been identified, the next step is to interpret these findings. This involves explaining what the patterns or themes mean in the context of the research question and the case. This interpretation should be grounded in the data, but it can also involve drawing on theoretical concepts or prior research.
Verification of the data
The last step in the analysis is verification. This involves checking the accuracy and consistency of the analysis process and confirming that the findings are supported by the data. This can involve re-checking the original data, checking the consistency of codes, or seeking feedback from research participants or peers.
Like any research method , case study research has its strengths and limitations. Researchers must be aware of these, as they can influence the design, conduct, and interpretation of the study.
Understanding the strengths and limitations of case study research can also guide researchers in deciding whether this approach is suitable for their research question . This section outlines some of the key strengths and limitations of case study research.
Benefits include the following:
- Rich, detailed data: One of the main strengths of case study research is that it can generate rich, detailed data about the case. This can provide a deep understanding of the case and its context, which can be valuable in exploring complex phenomena.
- Flexibility: Case study research is flexible in terms of design , data collection , and analysis . A sufficient degree of flexibility allows the researcher to adapt the study according to the case and the emerging findings.
- Real-world context: Case study research involves studying the case in its real-world context, which can provide valuable insights into the interplay between the case and its context.
- Multiple sources of evidence: Case study research often involves collecting data from multiple sources , which can enhance the robustness and validity of the findings.
On the other hand, researchers should consider the following limitations:
- Generalizability: A common criticism of case study research is that its findings might not be generalizable to other cases due to the specificity and uniqueness of each case.
- Time and resource intensive: Case study research can be time and resource intensive due to the depth of the investigation and the amount of collected data.
- Complexity of analysis: The rich, detailed data generated in case study research can make analyzing the data challenging.
- Subjectivity: Given the nature of case study research, there may be a higher degree of subjectivity in interpreting the data , so researchers need to reflect on this and transparently convey to audiences how the research was conducted.
Being aware of these strengths and limitations can help researchers design and conduct case study research effectively and interpret and report the findings appropriately.

Ready to analyze your data with ATLAS.ti?
See how our intuitive software can draw key insights from your data with a free trial today.
Quantitative study designs: Case Studies/ Case Report/ Case Series
Quantitative study designs.
- Introduction
- Cohort Studies
- Randomised Controlled Trial
- Case Control
- Cross-Sectional Studies
- Study Designs Home
Case Study / Case Report / Case Series
Some famous examples of case studies are John Martin Marlow’s case study on Phineas Gage (the man who had a railway spike through his head) and Sigmund Freud’s case studies, Little Hans and The Rat Man. Case studies are widely used in psychology to provide insight into unusual conditions.
A case study, also known as a case report, is an in depth or intensive study of a single individual or specific group, while a case series is a grouping of similar case studies / case reports together.
A case study / case report can be used in the following instances:
- where there is atypical or abnormal behaviour or development
- an unexplained outcome to treatment
- an emerging disease or condition
The stages of a Case Study / Case Report / Case Series
Which clinical questions does Case Study / Case Report / Case Series best answer?
Emerging conditions, adverse reactions to treatments, atypical / abnormal behaviour, new programs or methods of treatment – all of these can be answered with case studies /case reports / case series. They are generally descriptive studies based on qualitative data e.g. observations, interviews, questionnaires, diaries, personal notes or clinical notes.
What are the advantages and disadvantages to consider when using Case Studies/ Case Reports and Case Series ?
What are the pitfalls to look for?
One pitfall that has occurred in some case studies is where two common conditions/treatments have been linked together with no comprehensive data backing up the conclusion. A hypothetical example could be where high rates of the common cold were associated with suicide when the cohort also suffered from depression.
Critical appraisal tools
To assist with critically appraising Case studies / Case reports / Case series there are some tools / checklists you can use.
JBI Critical Appraisal Checklist for Case Series
JBI Critical Appraisal Checklist for Case Reports
Real World Examples
Some Psychology case study / case report / case series examples
Capp, G. (2015). Our community, our schools : A case study of program design for school-based mental health services. Children & Schools, 37(4), 241–248. A pilot program to improve school based mental health services was instigated in one elementary school and one middle / high school. The case study followed the program from development through to implementation, documenting each step of the process.
Cowdrey, F. A. & Walz, L. (2015). Exposure therapy for fear of spiders in an adult with learning disabilities: A case report. British Journal of Learning Disabilities, 43(1), 75–82. One person was studied who had completed a pre- intervention and post- intervention questionnaire. From the results of this data the exposure therapy intervention was found to be effective in reducing the phobia. This case report highlighted a therapy that could be used to assist people with learning disabilities who also suffered from phobias.
Li, H. X., He, L., Zhang, C. C., Eisinger, R., Pan, Y. X., Wang, T., . . . Li, D. Y. (2019). Deep brain stimulation in post‐traumatic dystonia: A case series study. CNS Neuroscience & Therapeutics. 1-8. Five patients were included in the case series, all with the same condition. They all received deep brain stimulation but not in the same area of the brain. Baseline and last follow up visit were assessed with the same rating scale.
References and Further Reading
Greenhalgh, T. (2014). How to read a paper: the basics of evidence-based medicine. (5th ed.). New York: Wiley.
Heale, R. & Twycross, A. (2018). What is a case study? Evidence Based Nursing, 21(1), 7-8.
Himmelfarb Health Sciences Library. (2019). Study design 101: case report. Retrieved from https://himmelfarb.gwu.edu/tutorials/studydesign101/casereports.cfm
Hoffmann T., Bennett S., Mar C. D. (2017). Evidence-based practice across the health professions. Chatswood, NSW: Elsevier.
Robinson, O. C., & McAdams, D. P. (2015). Four functional roles for case studies in emerging adulthood research. Emerging Adulthood, 3(6), 413-420.
- << Previous: Cross-Sectional Studies
- Next: Study Designs Home >>
- Last Updated: Jul 30, 2024 9:12 AM
- URL: https://deakin.libguides.com/quantitative-study-designs
Have a language expert improve your writing
Run a free plagiarism check in 10 minutes, generate accurate citations for free.
- Knowledge Base
Methodology
- Survey Research | Definition, Examples & Methods
Survey Research | Definition, Examples & Methods
Published on August 20, 2019 by Shona McCombes . Revised on June 22, 2023.
Survey research means collecting information about a group of people by asking them questions and analyzing the results. To conduct an effective survey, follow these six steps:
- Determine who will participate in the survey
- Decide the type of survey (mail, online, or in-person)
- Design the survey questions and layout
- Distribute the survey
- Analyze the responses
- Write up the results
Surveys are a flexible method of data collection that can be used in many different types of research .
Table of contents
What are surveys used for, step 1: define the population and sample, step 2: decide on the type of survey, step 3: design the survey questions, step 4: distribute the survey and collect responses, step 5: analyze the survey results, step 6: write up the survey results, other interesting articles, frequently asked questions about surveys.
Surveys are used as a method of gathering data in many different fields. They are a good choice when you want to find out about the characteristics, preferences, opinions, or beliefs of a group of people.
Common uses of survey research include:
- Social research : investigating the experiences and characteristics of different social groups
- Market research : finding out what customers think about products, services, and companies
- Health research : collecting data from patients about symptoms and treatments
- Politics : measuring public opinion about parties and policies
- Psychology : researching personality traits, preferences and behaviours
Surveys can be used in both cross-sectional studies , where you collect data just once, and in longitudinal studies , where you survey the same sample several times over an extended period.
Receive feedback on language, structure, and formatting
Professional editors proofread and edit your paper by focusing on:
- Academic style
- Vague sentences
- Style consistency
See an example

Before you start conducting survey research, you should already have a clear research question that defines what you want to find out. Based on this question, you need to determine exactly who you will target to participate in the survey.
Populations
The target population is the specific group of people that you want to find out about. This group can be very broad or relatively narrow. For example:
- The population of Brazil
- US college students
- Second-generation immigrants in the Netherlands
- Customers of a specific company aged 18-24
- British transgender women over the age of 50
Your survey should aim to produce results that can be generalized to the whole population. That means you need to carefully define exactly who you want to draw conclusions about.
Several common research biases can arise if your survey is not generalizable, particularly sampling bias and selection bias . The presence of these biases have serious repercussions for the validity of your results.
It’s rarely possible to survey the entire population of your research – it would be very difficult to get a response from every person in Brazil or every college student in the US. Instead, you will usually survey a sample from the population.
The sample size depends on how big the population is. You can use an online sample calculator to work out how many responses you need.
There are many sampling methods that allow you to generalize to broad populations. In general, though, the sample should aim to be representative of the population as a whole. The larger and more representative your sample, the more valid your conclusions. Again, beware of various types of sampling bias as you design your sample, particularly self-selection bias , nonresponse bias , undercoverage bias , and survivorship bias .
There are two main types of survey:
- A questionnaire , where a list of questions is distributed by mail, online or in person, and respondents fill it out themselves.
- An interview , where the researcher asks a set of questions by phone or in person and records the responses.
Which type you choose depends on the sample size and location, as well as the focus of the research.
Questionnaires
Sending out a paper survey by mail is a common method of gathering demographic information (for example, in a government census of the population).
- You can easily access a large sample.
- You have some control over who is included in the sample (e.g. residents of a specific region).
- The response rate is often low, and at risk for biases like self-selection bias .
Online surveys are a popular choice for students doing dissertation research , due to the low cost and flexibility of this method. There are many online tools available for constructing surveys, such as SurveyMonkey and Google Forms .
- You can quickly access a large sample without constraints on time or location.
- The data is easy to process and analyze.
- The anonymity and accessibility of online surveys mean you have less control over who responds, which can lead to biases like self-selection bias .
If your research focuses on a specific location, you can distribute a written questionnaire to be completed by respondents on the spot. For example, you could approach the customers of a shopping mall or ask all students to complete a questionnaire at the end of a class.
- You can screen respondents to make sure only people in the target population are included in the sample.
- You can collect time- and location-specific data (e.g. the opinions of a store’s weekday customers).
- The sample size will be smaller, so this method is less suitable for collecting data on broad populations and is at risk for sampling bias .
Oral interviews are a useful method for smaller sample sizes. They allow you to gather more in-depth information on people’s opinions and preferences. You can conduct interviews by phone or in person.
- You have personal contact with respondents, so you know exactly who will be included in the sample in advance.
- You can clarify questions and ask for follow-up information when necessary.
- The lack of anonymity may cause respondents to answer less honestly, and there is more risk of researcher bias.
Like questionnaires, interviews can be used to collect quantitative data: the researcher records each response as a category or rating and statistically analyzes the results. But they are more commonly used to collect qualitative data : the interviewees’ full responses are transcribed and analyzed individually to gain a richer understanding of their opinions and feelings.
Next, you need to decide which questions you will ask and how you will ask them. It’s important to consider:
- The type of questions
- The content of the questions
- The phrasing of the questions
- The ordering and layout of the survey
Open-ended vs closed-ended questions
There are two main forms of survey questions: open-ended and closed-ended. Many surveys use a combination of both.
Closed-ended questions give the respondent a predetermined set of answers to choose from. A closed-ended question can include:
- A binary answer (e.g. yes/no or agree/disagree )
- A scale (e.g. a Likert scale with five points ranging from strongly agree to strongly disagree )
- A list of options with a single answer possible (e.g. age categories)
- A list of options with multiple answers possible (e.g. leisure interests)
Closed-ended questions are best for quantitative research . They provide you with numerical data that can be statistically analyzed to find patterns, trends, and correlations .
Open-ended questions are best for qualitative research. This type of question has no predetermined answers to choose from. Instead, the respondent answers in their own words.
Open questions are most common in interviews, but you can also use them in questionnaires. They are often useful as follow-up questions to ask for more detailed explanations of responses to the closed questions.
The content of the survey questions
To ensure the validity and reliability of your results, you need to carefully consider each question in the survey. All questions should be narrowly focused with enough context for the respondent to answer accurately. Avoid questions that are not directly relevant to the survey’s purpose.
When constructing closed-ended questions, ensure that the options cover all possibilities. If you include a list of options that isn’t exhaustive, you can add an “other” field.
Phrasing the survey questions
In terms of language, the survey questions should be as clear and precise as possible. Tailor the questions to your target population, keeping in mind their level of knowledge of the topic. Avoid jargon or industry-specific terminology.
Survey questions are at risk for biases like social desirability bias , the Hawthorne effect , or demand characteristics . It’s critical to use language that respondents will easily understand, and avoid words with vague or ambiguous meanings. Make sure your questions are phrased neutrally, with no indication that you’d prefer a particular answer or emotion.
Ordering the survey questions
The questions should be arranged in a logical order. Start with easy, non-sensitive, closed-ended questions that will encourage the respondent to continue.
If the survey covers several different topics or themes, group together related questions. You can divide a questionnaire into sections to help respondents understand what is being asked in each part.
If a question refers back to or depends on the answer to a previous question, they should be placed directly next to one another.
Here's why students love Scribbr's proofreading services
Discover proofreading & editing
Before you start, create a clear plan for where, when, how, and with whom you will conduct the survey. Determine in advance how many responses you require and how you will gain access to the sample.
When you are satisfied that you have created a strong research design suitable for answering your research questions, you can conduct the survey through your method of choice – by mail, online, or in person.
There are many methods of analyzing the results of your survey. First you have to process the data, usually with the help of a computer program to sort all the responses. You should also clean the data by removing incomplete or incorrectly completed responses.
If you asked open-ended questions, you will have to code the responses by assigning labels to each response and organizing them into categories or themes. You can also use more qualitative methods, such as thematic analysis , which is especially suitable for analyzing interviews.
Statistical analysis is usually conducted using programs like SPSS or Stata. The same set of survey data can be subject to many analyses.
Finally, when you have collected and analyzed all the necessary data, you will write it up as part of your thesis, dissertation , or research paper .
In the methodology section, you describe exactly how you conducted the survey. You should explain the types of questions you used, the sampling method, when and where the survey took place, and the response rate. You can include the full questionnaire as an appendix and refer to it in the text if relevant.
Then introduce the analysis by describing how you prepared the data and the statistical methods you used to analyze it. In the results section, you summarize the key results from your analysis.
In the discussion and conclusion , you give your explanations and interpretations of these results, answer your research question, and reflect on the implications and limitations of the research.
If you want to know more about statistics , methodology , or research bias , make sure to check out some of our other articles with explanations and examples.
- Student’s t -distribution
- Normal distribution
- Null and Alternative Hypotheses
- Chi square tests
- Confidence interval
- Quartiles & Quantiles
- Cluster sampling
- Stratified sampling
- Data cleansing
- Reproducibility vs Replicability
- Peer review
- Prospective cohort study
Research bias
- Implicit bias
- Cognitive bias
- Placebo effect
- Hawthorne effect
- Hindsight bias
- Affect heuristic
- Social desirability bias
A questionnaire is a data collection tool or instrument, while a survey is an overarching research method that involves collecting and analyzing data from people using questionnaires.
A Likert scale is a rating scale that quantitatively assesses opinions, attitudes, or behaviors. It is made up of 4 or more questions that measure a single attitude or trait when response scores are combined.
To use a Likert scale in a survey , you present participants with Likert-type questions or statements, and a continuum of items, usually with 5 or 7 possible responses, to capture their degree of agreement.
Individual Likert-type questions are generally considered ordinal data , because the items have clear rank order, but don’t have an even distribution.
Overall Likert scale scores are sometimes treated as interval data. These scores are considered to have directionality and even spacing between them.
The type of data determines what statistical tests you should use to analyze your data.
The priorities of a research design can vary depending on the field, but you usually have to specify:
- Your research questions and/or hypotheses
- Your overall approach (e.g., qualitative or quantitative )
- The type of design you’re using (e.g., a survey , experiment , or case study )
- Your sampling methods or criteria for selecting subjects
- Your data collection methods (e.g., questionnaires , observations)
- Your data collection procedures (e.g., operationalization , timing and data management)
- Your data analysis methods (e.g., statistical tests or thematic analysis )
Cite this Scribbr article
If you want to cite this source, you can copy and paste the citation or click the “Cite this Scribbr article” button to automatically add the citation to our free Citation Generator.
McCombes, S. (2023, June 22). Survey Research | Definition, Examples & Methods. Scribbr. Retrieved August 19, 2024, from https://www.scribbr.com/methodology/survey-research/
Is this article helpful?

Shona McCombes
Other students also liked, qualitative vs. quantitative research | differences, examples & methods, questionnaire design | methods, question types & examples, what is a likert scale | guide & examples, "i thought ai proofreading was useless but..".
I've been using Scribbr for years now and I know it's a service that won't disappoint. It does a good job spotting mistakes”
Integrating case study and survey research methods: an example in information systems
- Original Article
- Published: 01 January 1994
- Volume 3 , pages 112–126, ( 1994 )
Cite this article

- G.G. Gable 1
606 Accesses
290 Citations
Explore all metrics
The case for combining research methods generally, and more specifically that for combining qualitative and quantitative methods, is strong. Yet, research designs that extensively integrate both fieldwork (e.g. case studies) and survey research are rare. Moreover, some journals tend tacitly to specialise by methodology thereby encouraging purity of method. The multi-method model of research, while not new, has not been appreciated. In this respect it is useful to describe its usage through example. By reference to a recently completed study of IS consultant engagement success factors this paper presents an analysis of the benefits of integrating case study and survey research methods. The emphasis is on the qualitative case study method and how it can complement more quantitative survey research. Benefits are demonstrated through specific examples from the reference study.
This is a preview of subscription content, log in via an institution to check access.
Access this article
Subscribe and save.
- Get 10 units per month
- Download Article/Chapter or eBook
- 1 Unit = 1 Article or 1 Chapter
- Cancel anytime
Price includes VAT (Russian Federation)
Instant access to the full article PDF.
Rent this article via DeepDyve
Institutional subscriptions
Challenges in Survey Research

Evidence-Based Survey Operations: Choosing and Mixing Modes

Systems Research Reporting
Author information, authors and affiliations.
Department of Information Systems and Computer Science, National University of Singapore, 0511 Singapore
You can also search for this author in PubMed Google Scholar
Rights and permissions
Reprints and permissions
About this article
Gable, G. Integrating case study and survey research methods: an example in information systems. Eur J Inf Syst 3 , 112–126 (1994). https://doi.org/10.1057/ejis.1994.12
Download citation
Published : 01 January 1994
Issue Date : 01 January 1994
DOI : https://doi.org/10.1057/ejis.1994.12
Share this article
Anyone you share the following link with will be able to read this content:
Sorry, a shareable link is not currently available for this article.
Provided by the Springer Nature SharedIt content-sharing initiative
- Find a journal
- Publish with us
- Track your research
- Privacy Policy
Home » Survey Research – Types, Methods, Examples
Survey Research – Types, Methods, Examples
Table of Contents

Survey Research
Definition:
Survey Research is a quantitative research method that involves collecting standardized data from a sample of individuals or groups through the use of structured questionnaires or interviews. The data collected is then analyzed statistically to identify patterns and relationships between variables, and to draw conclusions about the population being studied.
Survey research can be used to answer a variety of questions, including:
- What are people’s opinions about a certain topic?
- What are people’s experiences with a certain product or service?
- What are people’s beliefs about a certain issue?
Survey Research Methods
Survey Research Methods are as follows:
- Telephone surveys: A survey research method where questions are administered to respondents over the phone, often used in market research or political polling.
- Face-to-face surveys: A survey research method where questions are administered to respondents in person, often used in social or health research.
- Mail surveys: A survey research method where questionnaires are sent to respondents through mail, often used in customer satisfaction or opinion surveys.
- Online surveys: A survey research method where questions are administered to respondents through online platforms, often used in market research or customer feedback.
- Email surveys: A survey research method where questionnaires are sent to respondents through email, often used in customer satisfaction or opinion surveys.
- Mixed-mode surveys: A survey research method that combines two or more survey modes, often used to increase response rates or reach diverse populations.
- Computer-assisted surveys: A survey research method that uses computer technology to administer or collect survey data, often used in large-scale surveys or data collection.
- Interactive voice response surveys: A survey research method where respondents answer questions through a touch-tone telephone system, often used in automated customer satisfaction or opinion surveys.
- Mobile surveys: A survey research method where questions are administered to respondents through mobile devices, often used in market research or customer feedback.
- Group-administered surveys: A survey research method where questions are administered to a group of respondents simultaneously, often used in education or training evaluation.
- Web-intercept surveys: A survey research method where questions are administered to website visitors, often used in website or user experience research.
- In-app surveys: A survey research method where questions are administered to users of a mobile application, often used in mobile app or user experience research.
- Social media surveys: A survey research method where questions are administered to respondents through social media platforms, often used in social media or brand awareness research.
- SMS surveys: A survey research method where questions are administered to respondents through text messaging, often used in customer feedback or opinion surveys.
- IVR surveys: A survey research method where questions are administered to respondents through an interactive voice response system, often used in automated customer feedback or opinion surveys.
- Mixed-method surveys: A survey research method that combines both qualitative and quantitative data collection methods, often used in exploratory or mixed-method research.
- Drop-off surveys: A survey research method where respondents are provided with a survey questionnaire and asked to return it at a later time or through a designated drop-off location.
- Intercept surveys: A survey research method where respondents are approached in public places and asked to participate in a survey, often used in market research or customer feedback.
- Hybrid surveys: A survey research method that combines two or more survey modes, data sources, or research methods, often used in complex or multi-dimensional research questions.
Types of Survey Research
There are several types of survey research that can be used to collect data from a sample of individuals or groups. following are Types of Survey Research:
- Cross-sectional survey: A type of survey research that gathers data from a sample of individuals at a specific point in time, providing a snapshot of the population being studied.
- Longitudinal survey: A type of survey research that gathers data from the same sample of individuals over an extended period of time, allowing researchers to track changes or trends in the population being studied.
- Panel survey: A type of longitudinal survey research that tracks the same sample of individuals over time, typically collecting data at multiple points in time.
- Epidemiological survey: A type of survey research that studies the distribution and determinants of health and disease in a population, often used to identify risk factors and inform public health interventions.
- Observational survey: A type of survey research that collects data through direct observation of individuals or groups, often used in behavioral or social research.
- Correlational survey: A type of survey research that measures the degree of association or relationship between two or more variables, often used to identify patterns or trends in data.
- Experimental survey: A type of survey research that involves manipulating one or more variables to observe the effect on an outcome, often used to test causal hypotheses.
- Descriptive survey: A type of survey research that describes the characteristics or attributes of a population or phenomenon, often used in exploratory research or to summarize existing data.
- Diagnostic survey: A type of survey research that assesses the current state or condition of an individual or system, often used in health or organizational research.
- Explanatory survey: A type of survey research that seeks to explain or understand the causes or mechanisms behind a phenomenon, often used in social or psychological research.
- Process evaluation survey: A type of survey research that measures the implementation and outcomes of a program or intervention, often used in program evaluation or quality improvement.
- Impact evaluation survey: A type of survey research that assesses the effectiveness or impact of a program or intervention, often used to inform policy or decision-making.
- Customer satisfaction survey: A type of survey research that measures the satisfaction or dissatisfaction of customers with a product, service, or experience, often used in marketing or customer service research.
- Market research survey: A type of survey research that collects data on consumer preferences, behaviors, or attitudes, often used in market research or product development.
- Public opinion survey: A type of survey research that measures the attitudes, beliefs, or opinions of a population on a specific issue or topic, often used in political or social research.
- Behavioral survey: A type of survey research that measures actual behavior or actions of individuals, often used in health or social research.
- Attitude survey: A type of survey research that measures the attitudes, beliefs, or opinions of individuals, often used in social or psychological research.
- Opinion poll: A type of survey research that measures the opinions or preferences of a population on a specific issue or topic, often used in political or media research.
- Ad hoc survey: A type of survey research that is conducted for a specific purpose or research question, often used in exploratory research or to answer a specific research question.
Types Based on Methodology
Based on Methodology Survey are divided into two Types:
Quantitative Survey Research
Qualitative survey research.
Quantitative survey research is a method of collecting numerical data from a sample of participants through the use of standardized surveys or questionnaires. The purpose of quantitative survey research is to gather empirical evidence that can be analyzed statistically to draw conclusions about a particular population or phenomenon.
In quantitative survey research, the questions are structured and pre-determined, often utilizing closed-ended questions, where participants are given a limited set of response options to choose from. This approach allows for efficient data collection and analysis, as well as the ability to generalize the findings to a larger population.
Quantitative survey research is often used in market research, social sciences, public health, and other fields where numerical data is needed to make informed decisions and recommendations.
Qualitative survey research is a method of collecting non-numerical data from a sample of participants through the use of open-ended questions or semi-structured interviews. The purpose of qualitative survey research is to gain a deeper understanding of the experiences, perceptions, and attitudes of participants towards a particular phenomenon or topic.
In qualitative survey research, the questions are open-ended, allowing participants to share their thoughts and experiences in their own words. This approach allows for a rich and nuanced understanding of the topic being studied, and can provide insights that are difficult to capture through quantitative methods alone.
Qualitative survey research is often used in social sciences, education, psychology, and other fields where a deeper understanding of human experiences and perceptions is needed to inform policy, practice, or theory.
Data Analysis Methods
There are several Survey Research Data Analysis Methods that researchers may use, including:
- Descriptive statistics: This method is used to summarize and describe the basic features of the survey data, such as the mean, median, mode, and standard deviation. These statistics can help researchers understand the distribution of responses and identify any trends or patterns.
- Inferential statistics: This method is used to make inferences about the larger population based on the data collected in the survey. Common inferential statistical methods include hypothesis testing, regression analysis, and correlation analysis.
- Factor analysis: This method is used to identify underlying factors or dimensions in the survey data. This can help researchers simplify the data and identify patterns and relationships that may not be immediately apparent.
- Cluster analysis: This method is used to group similar respondents together based on their survey responses. This can help researchers identify subgroups within the larger population and understand how different groups may differ in their attitudes, behaviors, or preferences.
- Structural equation modeling: This method is used to test complex relationships between variables in the survey data. It can help researchers understand how different variables may be related to one another and how they may influence one another.
- Content analysis: This method is used to analyze open-ended responses in the survey data. Researchers may use software to identify themes or categories in the responses, or they may manually review and code the responses.
- Text mining: This method is used to analyze text-based survey data, such as responses to open-ended questions. Researchers may use software to identify patterns and themes in the text, or they may manually review and code the text.
Applications of Survey Research
Here are some common applications of survey research:
- Market Research: Companies use survey research to gather insights about customer needs, preferences, and behavior. These insights are used to create marketing strategies and develop new products.
- Public Opinion Research: Governments and political parties use survey research to understand public opinion on various issues. This information is used to develop policies and make decisions.
- Social Research: Survey research is used in social research to study social trends, attitudes, and behavior. Researchers use survey data to explore topics such as education, health, and social inequality.
- Academic Research: Survey research is used in academic research to study various phenomena. Researchers use survey data to test theories, explore relationships between variables, and draw conclusions.
- Customer Satisfaction Research: Companies use survey research to gather information about customer satisfaction with their products and services. This information is used to improve customer experience and retention.
- Employee Surveys: Employers use survey research to gather feedback from employees about their job satisfaction, working conditions, and organizational culture. This information is used to improve employee retention and productivity.
- Health Research: Survey research is used in health research to study topics such as disease prevalence, health behaviors, and healthcare access. Researchers use survey data to develop interventions and improve healthcare outcomes.
Examples of Survey Research
Here are some real-time examples of survey research:
- COVID-19 Pandemic Surveys: Since the outbreak of the COVID-19 pandemic, surveys have been conducted to gather information about public attitudes, behaviors, and perceptions related to the pandemic. Governments and healthcare organizations have used this data to develop public health strategies and messaging.
- Political Polls During Elections: During election seasons, surveys are used to measure public opinion on political candidates, policies, and issues in real-time. This information is used by political parties to develop campaign strategies and make decisions.
- Customer Feedback Surveys: Companies often use real-time customer feedback surveys to gather insights about customer experience and satisfaction. This information is used to improve products and services quickly.
- Event Surveys: Organizers of events such as conferences and trade shows often use surveys to gather feedback from attendees in real-time. This information can be used to improve future events and make adjustments during the current event.
- Website and App Surveys: Website and app owners use surveys to gather real-time feedback from users about the functionality, user experience, and overall satisfaction with their platforms. This feedback can be used to improve the user experience and retain customers.
- Employee Pulse Surveys: Employers use real-time pulse surveys to gather feedback from employees about their work experience and overall job satisfaction. This feedback is used to make changes in real-time to improve employee retention and productivity.
Survey Sample
Purpose of survey research.
The purpose of survey research is to gather data and insights from a representative sample of individuals. Survey research allows researchers to collect data quickly and efficiently from a large number of people, making it a valuable tool for understanding attitudes, behaviors, and preferences.
Here are some common purposes of survey research:
- Descriptive Research: Survey research is often used to describe characteristics of a population or a phenomenon. For example, a survey could be used to describe the characteristics of a particular demographic group, such as age, gender, or income.
- Exploratory Research: Survey research can be used to explore new topics or areas of research. Exploratory surveys are often used to generate hypotheses or identify potential relationships between variables.
- Explanatory Research: Survey research can be used to explain relationships between variables. For example, a survey could be used to determine whether there is a relationship between educational attainment and income.
- Evaluation Research: Survey research can be used to evaluate the effectiveness of a program or intervention. For example, a survey could be used to evaluate the impact of a health education program on behavior change.
- Monitoring Research: Survey research can be used to monitor trends or changes over time. For example, a survey could be used to monitor changes in attitudes towards climate change or political candidates over time.
When to use Survey Research
there are certain circumstances where survey research is particularly appropriate. Here are some situations where survey research may be useful:
- When the research question involves attitudes, beliefs, or opinions: Survey research is particularly useful for understanding attitudes, beliefs, and opinions on a particular topic. For example, a survey could be used to understand public opinion on a political issue.
- When the research question involves behaviors or experiences: Survey research can also be useful for understanding behaviors and experiences. For example, a survey could be used to understand the prevalence of a particular health behavior.
- When a large sample size is needed: Survey research allows researchers to collect data from a large number of people quickly and efficiently. This makes it a useful method when a large sample size is needed to ensure statistical validity.
- When the research question is time-sensitive: Survey research can be conducted quickly, which makes it a useful method when the research question is time-sensitive. For example, a survey could be used to understand public opinion on a breaking news story.
- When the research question involves a geographically dispersed population: Survey research can be conducted online, which makes it a useful method when the population of interest is geographically dispersed.
How to Conduct Survey Research
Conducting survey research involves several steps that need to be carefully planned and executed. Here is a general overview of the process:
- Define the research question: The first step in conducting survey research is to clearly define the research question. The research question should be specific, measurable, and relevant to the population of interest.
- Develop a survey instrument : The next step is to develop a survey instrument. This can be done using various methods, such as online survey tools or paper surveys. The survey instrument should be designed to elicit the information needed to answer the research question, and should be pre-tested with a small sample of individuals.
- Select a sample : The sample is the group of individuals who will be invited to participate in the survey. The sample should be representative of the population of interest, and the size of the sample should be sufficient to ensure statistical validity.
- Administer the survey: The survey can be administered in various ways, such as online, by mail, or in person. The method of administration should be chosen based on the population of interest and the research question.
- Analyze the data: Once the survey data is collected, it needs to be analyzed. This involves summarizing the data using statistical methods, such as frequency distributions or regression analysis.
- Draw conclusions: The final step is to draw conclusions based on the data analysis. This involves interpreting the results and answering the research question.
Advantages of Survey Research
There are several advantages to using survey research, including:
- Efficient data collection: Survey research allows researchers to collect data quickly and efficiently from a large number of people. This makes it a useful method for gathering information on a wide range of topics.
- Standardized data collection: Surveys are typically standardized, which means that all participants receive the same questions in the same order. This ensures that the data collected is consistent and reliable.
- Cost-effective: Surveys can be conducted online, by mail, or in person, which makes them a cost-effective method of data collection.
- Anonymity: Participants can remain anonymous when responding to a survey. This can encourage participants to be more honest and open in their responses.
- Easy comparison: Surveys allow for easy comparison of data between different groups or over time. This makes it possible to identify trends and patterns in the data.
- Versatility: Surveys can be used to collect data on a wide range of topics, including attitudes, beliefs, behaviors, and preferences.
Limitations of Survey Research
Here are some of the main limitations of survey research:
- Limited depth: Surveys are typically designed to collect quantitative data, which means that they do not provide much depth or detail about people’s experiences or opinions. This can limit the insights that can be gained from the data.
- Potential for bias: Surveys can be affected by various biases, including selection bias, response bias, and social desirability bias. These biases can distort the results and make them less accurate.
- L imited validity: Surveys are only as valid as the questions they ask. If the questions are poorly designed or ambiguous, the results may not accurately reflect the respondents’ attitudes or behaviors.
- Limited generalizability : Survey results are only generalizable to the population from which the sample was drawn. If the sample is not representative of the population, the results may not be generalizable to the larger population.
- Limited ability to capture context: Surveys typically do not capture the context in which attitudes or behaviors occur. This can make it difficult to understand the reasons behind the responses.
- Limited ability to capture complex phenomena: Surveys are not well-suited to capture complex phenomena, such as emotions or the dynamics of interpersonal relationships.
Following is an example of a Survey Sample:
Welcome to our Survey Research Page! We value your opinions and appreciate your participation in this survey. Please answer the questions below as honestly and thoroughly as possible.
1. What is your age?
- A) Under 18
- G) 65 or older
2. What is your highest level of education completed?
- A) Less than high school
- B) High school or equivalent
- C) Some college or technical school
- D) Bachelor’s degree
- E) Graduate or professional degree
3. What is your current employment status?
- A) Employed full-time
- B) Employed part-time
- C) Self-employed
- D) Unemployed
4. How often do you use the internet per day?
- A) Less than 1 hour
- B) 1-3 hours
- C) 3-5 hours
- D) 5-7 hours
- E) More than 7 hours
5. How often do you engage in social media per day?
6. Have you ever participated in a survey research study before?
7. If you have participated in a survey research study before, how was your experience?
- A) Excellent
- E) Very poor
8. What are some of the topics that you would be interested in participating in a survey research study about?
……………………………………………………………………………………………………………………………………………………………………………………………………………………………………………………………………….
9. How often would you be willing to participate in survey research studies?
- A) Once a week
- B) Once a month
- C) Once every 6 months
- D) Once a year
10. Any additional comments or suggestions?
Thank you for taking the time to complete this survey. Your feedback is important to us and will help us improve our survey research efforts.
About the author

Muhammad Hassan
Researcher, Academic Writer, Web developer
You may also like

Focus Groups – Steps, Examples and Guide

Case Study – Methods, Examples and Guide

Quantitative Research – Methods, Types and...

One-to-One Interview – Methods and Guide

Textual Analysis – Types, Examples and Guide

Research Methods – Types, Examples and Guide
Case Study vs. Survey: What's the Difference?

Key Differences
Comparison chart, methodology, generalizability, case study and survey definitions, what is the purpose of a case study, what is a case study, can case studies be generalized, can case studies be biased, are case studies credible, how is data collected in a case study, how long does a case study take, what is a survey, are case studies qualitative or quantitative, what fields use case studies, are surveys qualitative or quantitative, how are survey results analyzed, what challenges are associated with surveys, can surveys predict behavior, what makes a good case study, what types of surveys exist, what is a good response rate for a survey, what is the purpose of a survey, can surveys be biased, how are surveys conducted.

Trending Comparisons

Popular Comparisons

New Comparisons

Warning: The NCBI web site requires JavaScript to function. more...

An official website of the United States government
The .gov means it's official. Federal government websites often end in .gov or .mil. Before sharing sensitive information, make sure you're on a federal government site.
The site is secure. The https:// ensures that you are connecting to the official website and that any information you provide is encrypted and transmitted securely.
- Publications
- Account settings
- Browse Titles
NCBI Bookshelf. A service of the National Library of Medicine, National Institutes of Health.
Maben J, Griffiths P, Penfold C, et al. Evaluating a major innovation in hospital design: workforce implications and impact on patient and staff experiences of all single room hospital accommodation. Southampton (UK): NIHR Journals Library; 2015 Feb. (Health Services and Delivery Research, No. 3.3.)

Evaluating a major innovation in hospital design: workforce implications and impact on patient and staff experiences of all single room hospital accommodation.
Chapter 5 case study quantitative data findings.
- Introduction
This chapter provides the results of the analysis of quantitative data from three different sources:
- Staff activity: task time distribution. Observations of staff activities were undertaken in each study ward to understand the types of tasks undertaken by staff and the proportion of time spent on each. Staff were shadowed by a researcher who logged their activities.
- Staff travel distances. These were collected by staff wearing pedometers. These data were collected before and after the shadowing sessions.
- Staff experience surveys. Staff surveys on each ward were conducted before and after the move to the new hospital and these data provide a comparison of perceptions of the ward environment in the old and new wards.
The survey probed perceptions of many aspects of the ward environment before and after the move. As discussed in Chapter 3 , the trust, the designers and stakeholders held various expectations about the benefits of the 100% single room design. We examined whether or not these expectations (or hypotheses about the effect of the move) were fulfilled. Specifically, the new hospital was designed to increase patient comfort, prevent infections, reduce numbers of patient falls, reduce patient stress, increase patient-centred care and increase the time spent by nurses on direct care (see Appendix 16 ). Concerns were raised about the possible reduction in staff observing and monitoring patients, increased travel distances and patient isolation.
This chapter primarily addresses the following two research questions:
- What are the advantages and disadvantages of a move to all single rooms for staff?
- Does the move to all single rooms affect staff experience and well-being and their ability to deliver effective and high-quality care?
- Staff activity: task time distribution results
Preliminary analysis showed that five activity categories accounted for 78% of observation data before the move and 83% of observation data after the move. This meant that numbers in the remaining categories were too low for analysis, so all subsequent analyses were confined to these five categories: direct care, indirect care, professional communication, medication tasks and ward-related activities. Proportion of time was derived by calculating the duration of each event from its start and end time, and then aggregating duration by activity for each observation session. The number of events for each activity was also counted ( Table 23 ).
Observations (events) per session before and after new build
Proportion of time spent in each type of activity was analysed using a general linear model with proportion of time as the dependent variable. The first model consisted of a single independent variable for before and after the new build and was used to ascertain the effect of the move to a new build, prior to adjusting for other variables. To this model were added ward (maternity, surgical, older people, AAU), staff group (midwife, RN, HCA) and day of the week. This second model was used to ascertain the effect of the move to the new build having adjusted for these variables.
Events were defined as a switch of activity (either to a new activity or to continue a previously interrupted activity) and were captured by a new entry in the PDA. The number of events (new or continuation of a previous activity) per hour was modelled in the same way except that a generalised linear model with a Poisson distribution and shift length in hours specified as offset (equivalent to modelling the hourly rate) was fitted to the data. An unadjusted analysis (before and after the new build only) and adjusted analysis (before and after the new build, ward, staff group and day of week) were performed.
Analysis of medication tasks was confined to RNs only. The fact that RMs work only on the postnatal ward means that it would not be possible to interpret whether any obtained results were due to the effect of the professional group or the ward. Therefore, staff group (i.e. midwives) was dropped from this model. On average the number of events (either new or continuations of previous activities) observed per session was higher before the move than after (177 vs. 153).
However, the move to the new build did not result in a significant change to the proportion of time spent on different activities ( Table 24 ). Although there was an increase in the proportion of direct care, indirect care, professional communication and medication tasks and a decrease in ward-related activities such as cleaning, bed making and stocking the utility room in adjusted analyses, none of these changes was statistically significant (see Table 24 ).
Mean proportion of time spent in each type of activity before and after move
Table 25 shows results for the analysis of the number of events per hour. The adjusted number of recorded events per hour decreased significantly for direct care ( p = 0.039) and professional communication ( p = 0.002), and increased significantly for medication tasks. A decrease in the number of events per hour for an activity, and no change in the proportion of time spent on that activity, suggests that there were fewer interruptions during these tasks and work was, therefore, less fragmented. This interpretation is supported by qualitative data showing that nurses could focus on direct care and communication tasks more easily in the single room environment. Staff had difficulty locating each other and also felt reluctant to interrupt a colleague providing direct care in a single room, and there were more frequent structured opportunities for professional communication within the small nursing teams.
Number of events per hour by type of activity before and after move
The number of events per hour increased significantly for medication tasks ( p = 0.001), showing increased fragmentation for this task. Again, this interpretation is supported by the qualitative data showing that when staff entered a patient room to administer medication they were likely to engage in other direct care activities; thus medication administration was not carried out in a single medication round, but integrated into patient care activities generally.
We also assessed the changes in patients’ contact time per patient-day to check if nurses spent more time with the patient instead of doing other activities. The analysis draws on day shift observation data (based on 118.5 hours of staff shadowing before the move and 254.5 hours after the move). The proportion of contact time was applied to the total NHPPD to provide an estimate of the patients’ contact time per patient-day (see Table 26 ).
Patients’ contact time per patient-day before and after move in the case study wards
After the move, the contact time per patient-days increased in all units, apart from surgery, where there was a decrease in direct care and an increase in indirect care activities, for example medication activities and professional communication, and essential ward/patient care activities.
These changes are the result of a combination of two factors: a change in the proportion of care (i.e. an increase/decrease in the time spent with the patient) and a change in NHPPD (i.e. an increase/decrease in the number of nurses working full-time during a day).
- Staff travel distances results
Statistical analysis
The data were analysed using a repeated measures general linear mixed model (GLMM) with steps per hour as the dependent variable and pre/post new build, ward (maternity, surgical, older people, AAU), observation session (repeated measure), staff group (midwife, RN, HCA) and day of the week as independent variables. The first GLMM analysis investigated the main effects of ward, pre/post move, staff group and day of the week. The second GLMM analysis investigated the interactions between pre/post move and ward, and between pre/post move and staff group. Because midwives were employed only on the maternity ward, there was potential confounding between the effects of ward and staff type. Initial analyses confirmed that removing maternity from the analyses improved the fit of the models. The first sensitivity analysis added a variable to the model that indicated whether or not a member of staff contributed to both the pre- and post-build samples. Only five staff contributed to both. The effect on the overall results was minor. A second sensitivity analysis fitted a model to first observation session data only, but allowed data to repeat across individual staff before and after the build. We report the results below, including where sensitivity analyses identified differences.
The data set contains information on 140 sessions collected on 53 staff (49%) prior to and 56 staff (51%) after the new build. A number of staff contributed more than one observation session: 85 provided one session, 18 provided two sessions, five provided three sessions and one provided four sessions. There were 73 sessions (52%) collected prior to the new build and 67 sessions (48%) after the new build. The average numbers of sessions per member of staff were 1.38 and 1.20, respectively. A small number of staff ( n = 5, 4%) were observed at both times (one RN and four HCAs). Table 27 shows descriptive data for ward and staff group.
Steps per hour before and after new build
The unadjusted means (see Table 27 ) show an increase in the number of steps per hour for all wards and staff groups. Staff working on the older people’s ward (from 664 to 845) and RNs (from 639 to 827) have seen the biggest increases.
Table 28 shows results for the main effects of ward, pre/post move, staff group and day of the week. The number of steps per hour increased significantly from a mean of 715 before the move to a mean of 839 [ F (1,83) = 10.36; p = 0.002] after the move. HCAs took significantly more steps per hour than nurses [ F (1,83) = 8.01; p = 0.006]. There were also significant differences between days of the week [ F (4,21) = 3.40; p = 0.027]. There was no significant difference between wards in the distances travelled ( Table 29 ).
F -tests on main effects
Mean steps per hour by wards, pre-/post move, staff group and day of the week
Table 30 shows results for the interactions between pre/post move and ward, and between pre/post move and staff group. Neither of the two interactions was statistically significant.
F -tests on interaction effects
The estimated marginal means ( Table 31 ) showed that there was an increase from pre to post build across all wards. Although the size of this increase did not differ significantly between wards, the increases in the surgical and older people’s wards were larger than for the AAU. RNs experienced a larger increase (from 624 to 811) in the number of steps per hour (from 3.74 to 4.86 miles) than HCAs (from 828 to 862 steps; from 4.96 to 5.17 miles).
Mean steps per hour for the interactions
The estimated marginal means from the second sensitivity analysis suggested a decrease in the number of steps per hour for the AAU from 901 to 836 and for HCAs from 876 to 855, rather than an increase as shown in Table 31 . The change in means for the remaining two wards and for RNs, from pre to post build, were in the same direction, and of the same order of magnitude (see Table 31 ).
- Staff experience survey
Because of staff leave, shift patterns and staff turnover during the course of the study, it was not possible to use a completely within-subjects design, in which the pre- and post-move surveys were completed by the same people. Despite this, 19 participants did complete surveys at both times, which meant a mixed within- and between-subjects design. One potential problem with this is that the subgroup who completed both surveys could have been sensitised to the research questions and, therefore, could have been more likely to report differences after the move than those who completed only one survey; that would bias our results. We addressed this by treating the design as a between-subjects design and checking for bias by comparing the results of our analyses for the whole group with separate within-subjects analyses on the subgroup who completed both surveys. The results were identical except for a small difference: perceptions of the effect of the accommodation on the delivery of care approached significance (0.099) in the within-subjects analysis whereas for the whole group this effect was significant (0.011). This can be attributed to lack of power in the subsample of 19. On this basis we proceeded with the analysis by treating the ‘before’ and ‘after’ samples as independent groups.
There were 152 items in the staff survey. Our approach to analysis was multifaceted. First, we explored the potential for grouping questions into subscales that would summarise a topic area. We thematically analysed the questions to determine those that were likely to be measuring attitudes to related aspects of the ward design, and then tested these subscales using statistical reliability analysis. Where reliability was not adequate we revised the items in the subscales until we had identified coherent subscales. These were then analysed using independent sample t -tests to determine if post-move responses were significantly different from the pre-move scores for each subscale. Similar analyses were undertaken for the teamwork and safety climate scales. Qualitative open-ended questions were analysed thematically using a content analytic approach. The well-being and stress items were compared before and after the move using the Pearson chi-squared test and Fisher’s exact test when expected frequencies were less than 5.
One of the aims of the study was to investigate if there were differences between the case study wards in their perceptions of the positives and negatives of the new single room accommodation. However, the relatively small number of staff in each of the case study wards meant that it was not possible to explore this question statistically. We therefore used correspondence analysis and perceptual mapping to examine the interaction between ward attributes and case study wards. Correspondence analysis is an exploratory mapping tool that allows visualisation of relationships in the data that would be difficult to identify if presented in a table. 114 It is related to other techniques such as factor analysis and multidimensional scaling. It does not rely on significance testing and is best viewed as an exploratory technique that provides insights into the similarities and differences between two variables. 115 Correspondence analysis does not address questions of whether or not there were differences in ratings between the attributes (e.g. whether or not privacy for patients was rated more highly than staff teamwork). Instead, it focuses on the differences between case study wards and the interaction between ratings and wards. It allows an examination of to what extent which wards are associated with particular ratings. In this way it allows us to qualitatively explore the quantitative data.
Ward environment survey subscales
Ten reliable subscales were formed. Table 32 shows the subscales and example items from each.
Description of subscales
Appendix 19 contains a complete list of all items used for each subscale.
Table 33 summarises the statistical analysis of the subscales showing means, Cronbach’s alpha and the number of items for each subscale before and after the move. According to accepted criteria, 115 alpha above 0.60 is acceptable for exploratory analyses, above 0.70 is acceptable for confirmatory purposes and above 0.80 is good for confirmatory purposes. Obtained coefficients were generally good, ranging mostly between 0.67 and 0.92. The lowest alpha, of 0.53, was obtained for the family/visitors subscale after the move, suggesting that this subscale is not internally consistent. However, the pre-move alpha was good (0.70), so it was decided to retain this subscale for exploratory purposes.
Mean subscale scores and reliability analysis before and after the move
Table 34 shows the results of independent sample t -tests comparing subscale scores before and after the move. Staff perceived significant improvements in the efficiency of the physical environment, the patient amenity, the effect of the environment on infection control, patient privacy, and family and visitors. The largest increases were found for perceptions of infection control and patient privacy. Perceptions of the effect of the ward environment on teamwork and care delivery were significantly more negative after the move. There were no significant differences in staff perceptions of staff facilities, patient safety and staff safety.
Results of t -tests comparing perceptions of the ward environment before and after the move
Although all subscales showed moderate to very good reliability, changes were not uniform for all items in every subscale; there were some exceptions to the overall trend. Overall ratings for the subscale ‘efficiency of physical environment’ increased, but ratings for the item ‘ward design/layout minimises walking distances for staff’ decreased. These perceptions were confirmed by our findings from the analysis of travel distances showing that staff took significantly more steps after than before the move. Some aspects of the design increased the amenity of the ward for staff but others did not. For example, staff toilet facilities, locker facilities and space at staff bases were rated more highly but ratings for social interaction and natural light decreased. These positive and negative aspects meant there was no significant difference in staff amenity before and after the move. The new ward was rated as much more positive for patients but there were reduced scores for three items after the move: social contact between patients, ability of patients to see staff and way finding. All aspects of teamwork and training were rated less positively, except for the item ‘discussing patient care with colleagues’, which increased. This finding is supported by our analysis of observation data showing that professional communication activities were less fragmented.
Although there were no significant differences in the effect of the ward layout on perceptions of patient safety, examination of the items showed that ratings for two items increased (‘minimising risk to patients of physical/verbal abuse from other patients/visitors’ and ‘minimising the risk of medication errors’) while ratings for two items decreased (‘responding to patient calls for assistance’ and ‘minimising the risk of falls/injury to patients’). This suggests that, although staff thought some risks to safety were reduced, they perceived an increased risk of falls and delays in responding to calls for assistance. Staff perceptions of a rise in risk of falls are detailed in Chapter 6 . Staff also reported being unable to hear calls for assistance when in a single room with a patient.
There were five items that did not fit into any of the subscales. These items were analysed singly using Fisher’s exact test and the results are shown in Table 35 . There was a significant relationship between the move and ratings for the number and location of hand basins, ease of keeping patient areas clean and quiet, and the overall comfort of patients, which all increased after the move. There was no relationship between the move and judgements of whether or not the location of the dirty utility room (where bedpans are stored and disposed of) reduces cross-contamination.
Results of single-item analyses
The distribution of responses for the four significant items showed that significantly more staff rated these aspects of single room accommodation as more positive after the move than before ( Tables 36 – 39 ).
Distribution of responses for the item ‘Number and location of CHWBs supports good hand hygiene’
Distribution of responses for the item ‘Easy to keep patient care areas clean’
Distribution of responses for the item ‘Overall comfort of patients’
Distribution of responses for the item ‘Easy to keep patient care areas quiet’
Expectations before the move and reality after the move
Before the move, staff were asked to rate on a five-point scale whether they thought single rooms would be better or worse for different aspects of clinical work (e.g. minimising the risk of patient falls, maintaining patient confidentiality, knowing when other staff might need help). After the move they again rated whether single rooms were better or worse for clinical work, thus providing a measure of whether or not their expectations about single rooms were met in reality. The questions were a subset of 23 questions from the first part of the survey and were analysed using Fisher’s exact test.
Results ( Table 40 ) showed that staff perceptions of whether or not single rooms were better than multibedded wards changed after the move for five items. Staff perceptions of whether or not single rooms were better for responding to calls for assistance, knowing when other staff might need help and minimising walking distances were rated as worse or much worse by significantly more staff after than before the move. Staff rated single rooms as positive for patient sleep and rest and for interactions between patients and visitors after the move.
Relationship between expectations before the move and reality after the move
Tables 41 – 45 show the distribution of significant responses.
Distribution of responses for the item ‘Responding to patient calls for assistance’
Distribution of responses for the item ‘Minimising staff walking distances’
Distribution of responses for the item ‘Patient sleep and rest’
Distribution of responses for the item ‘Knowing when other staff might need a helping hand’
Distribution of responses for the item ‘Patient interaction with visitors’
Teamwork and safety climate survey
To take into account our changes to the survey, we combined the four items about the quality of communication with doctors, nurses, nursing assistants and AHPs with the items in the information handover subscale to form a new subscale of seven items. Although this is different from the scales reported by Hutchinson et al. , 98 reliability analysis confirmed the original factor structure of the survey. There were two teamwork subscales and three safety climate subscales with good to high reliability ( Table 46 ). See Appendix 20 for a list of the items contained in each subscale.
Mean scores for all subscales decreased following the move. Independent sample t -tests showed that ratings for information handover and communication decreased significantly following the move [ t = 3.23, degrees of freedom (df) = 108, p = 0.002], indicating that information exchange and sharing within teams was perceived to be worse after the move. There were no other significant differences.
Correspondence analysis
Correspondence analysis transforms cross-tabulated data into a biplot showing distances between variables. In this study, case study ward was a column variable and mean questionnaire subscale score was a row variable (see Table 33 ). As appropriate when analysing mean scores, Euclidean distance was used and standardisation by removing row means was used. 114 , 116 This means that differences between the subscale means were not represented in the perceptual map, as we were not interested in whether or not, for example, infection control was rated more highly than privacy. Differences between wards, contained in the columns, were of interest and are represented in the perceptual map. Separate analyses were conducted for before and after the move and for the ward attributes and teamwork/safety climate survey.
Figure 11 shows perceptual maps of the association between ward attributes and wards before and after the move. The pre-move map shows that the points on the map were dispersed, indicating that the ratings were not strongly associated with particular wards. There was one exception in that ratings for the efficiency of the physical environment, privacy and infection control were higher for the older people’s ward than for the other wards. The post-move map shows that the highest ratings for the efficiency of the physical environment, the delivery of care, the staff facilities and teamwork were obtained in the older people’s and surgical wards, indicated by proximity on the map. Ratings for patient amenity, infection control, privacy and family/visitors were highest for the surgical ward. High ratings for patient safety were obtained in maternity and the surgical ward. Ratings for staff safety were similar in the older people’s, surgical and maternity wards. The acute assessment ward was not associated with any particular ward attributes, as was the case before the move.
Perceptual maps of (a) pre- and (b) post-move ward attributes by ward.
Figure 12 shows perceptual maps before and after the move of the association between teamwork/safety climate ratings and wards. The teamwork/safety climate survey consisted of two teamwork subscales – team input into decisions, and information handover and communication – and three safety climate subscales – attitudes to safety within own team, overall confidence in safety of organisation and perceptions of management attitudes to safety. The pre-move map shows that ratings of input into decisions, information and handover, and overall confidence in safety of the organisation were highest for the acute assessment ward. Ratings of safety attitudes within the team and management attitudes to safety were highest for the surgical ward. After the move, the surgical ward had the highest ratings for safety attitudes within the team, overall attitudes to safety and management; ratings for team input into decisions and information handover and communication were highest for the older people’s ward. Ratings for all safety climate subscales decreased in the acute assessment ward, which is indicated on the perceptual map by its location in a quadrant by itself. Maternity scores did not show a consistent pattern.
Perceptual map of (a) pre- and (b) post-move ratings of teamwork/safety climate by ward. Att., attitude; mgt., management.
These maps reveal some differences between wards in perceptions of the ward environment and show that perceptions were different before and after the move.
Staff ward preferences
Nursing staff were asked to indicate whether they would prefer single rooms, multibedded accommodation or a combination. There was a range of views ( Figure 13 ). In each phase, fewer than 18% of staff indicated a preference for 100% single rooms. The most common preference in each phase was a combination of 50% of beds in single rooms and 50% in bays (see Figure 13 ). In the pre-move survey, more staff reported a preference for more beds in bays ( n = 20) than in the post-move phase ( n = 12).
Nurse preferences for single room or multibedded accommodation.
Staff stress and well-being
There were five categorical questions about staff well-being that investigated whether or not they had experienced injuries and harassment in the previous 12 months ( Table 47 ). There were three items about job stress that asked participants to rate their stress on a five-point Likert scale ( Table 48 ) . Results showed no differences in staff well-being and stress before and after the move.
Relationship between move and staff well-being
Relationship between move and staff stress
Staff were asked 10 questions about their satisfaction with their own performance of various tasks during their last shift, and one question about their overall job satisfaction. Results ( Table 49 ) showed no significant effect for any of the job satisfaction items.
Relationship between job satisfaction and move
Qualitative survey data
Four open-ended questions were used to gain qualitative data about staff attitudes. The questions were:
- What two things do you think would most improve the current ward environment for staff?
- What two things do you think would most improve the current ward environment for patients?
- What two things are you most looking forward to in relation to the move to 100% single rooms in the new hospital?
- What two things are you most concerned about in relation to the move to 100% single rooms in the new hospital?
- What two things do you like the most about single room wards in the new hospital?
- What two things do you dislike most about single room wards in the new hospital?
In the following sections we present the results of the thematic analysis with frequency data (almost equal numbers of staff responded before and after the move, n = 55 and n = 54 respectively) and examples from participants’ written responses where appropriate. Table 50 shows that staff identified a number of things that would improve the ward accommodation for patients. The need for more space, improved patient facilities, privacy, and rest and sleep were largely met, since there were fewer people identifying these as needs after the move. However, the need for improved patient–staff ratios and a day room to provide patient social interaction were still reported after the move.
What would improve the current ward environment for patients ? Response frequencies
The need that staff perceived before the move for space around patient beds and staffing levels had decreased after the move ( Table 51 ). However, ventilation/heating/lighting, access to equipment and supplies and facilities for staff, including staff bases, were identified as needing improvement after move. In addition there was a need for improvements in monitoring patients, keeping track of colleagues, reducing isolation and reducing walking distances. These have all been identified by other parts of our results (see Chapter 6 ).
What would improve the current ward environment for staff ? Response frequencies
Staff were asked about the features of the ward they were most looking forward to in the pre-move phase, and most liked in the post-move phase ( Table 52 ). Results showed that staff most liked the increased patient privacy, patient sleep and rest, increased space, working in a modern environment and improved patient bathroom facilities.
What are you most looking forward to/do you most like about 100% single room accommodation? Response frequencies
Table 53 shows that staff were most concerned about being able to monitor patients, patient isolation and the risk of falls. Being unable to find staff and increased walking distances also emerged as features staff disliked about single rooms.
What are you most concerned about/do you most dislike about 100% single room accommodation? Response frequencies
- Most staff would prefer a mix of single rooms and multibedded rooms on wards.
- Staff activity events observed per session were higher after the move and direct care and professional communication events per hour decreased significantly, suggesting fewer interruptions and less fragmented care.
- A significant increase in medication tasks among recorded events suggests medication administration was integrated into patient care activities and was not undertaken as a medication ‘round’.
- Travel distances increased for all staff, with highest increases for staff in the older people’s ward and surgical wards and for RNs/RMs.
- efficiency in carrying out tasks
- patient amenity, including comfort, space, sleep, light and ventilation
- infection control
- patient privacy
- patient interaction with family/visitors and their involvement in care.
- In open comments, staff most liked the increased patient privacy, working in a modern environment, improved patient sleep and rest, and space around the bedside.
- delivery of care, including factors such as spending time with patients, communication with patients, monitoring patients and remaining close to patients, responding to calls for assistance, minimising the risks to staff, minimising walking distances and staff spending time with patients
- teamwork, including being able to locate staff, obtain assistance from colleagues, informal learning, keeping team members updated, discussing care with colleagues and knowing when other staff might need help.
- In addition, in open comments staff were most concerned about patient isolation, the risk of falls and staff isolation.
- There were no perceived differences in staff amenity and patient and staff safety.
- Ratings for information handover and communication decreased significantly following the move. This suggests that information exchange and sharing within teams – and between professions – was perceived to be worse after the move.
- Different wards valued different aspects of the ward environment.
- Ratings for staff toilet facilities, locker facilities and space at staff bases were rated more highly but ratings for social interaction and natural light decreased.
- No differences were found in staff job satisfaction, well-being or stress before and after the move.
- The need for improved patient–staff ratios and a day room to provide patient social interaction was still reported after the move.
Included under terms of UK Non-commercial Government License .
- Cite this Page Maben J, Griffiths P, Penfold C, et al. Evaluating a major innovation in hospital design: workforce implications and impact on patient and staff experiences of all single room hospital accommodation. Southampton (UK): NIHR Journals Library; 2015 Feb. (Health Services and Delivery Research, No. 3.3.) Chapter 5, Case study quantitative data findings.
- PDF version of this title (96M)
In this Page
Other titles in this collection.
- Health Services and Delivery Research
Recent Activity
- Case study quantitative data findings - Evaluating a major innovation in hospita... Case study quantitative data findings - Evaluating a major innovation in hospital design: workforce implications and impact on patient and staff experiences of all single room hospital accommodation
Your browsing activity is empty.
Activity recording is turned off.
Turn recording back on
Connect with NLM
National Library of Medicine 8600 Rockville Pike Bethesda, MD 20894
Web Policies FOIA HHS Vulnerability Disclosure
Help Accessibility Careers
- Multi-Tiered System of Supports Build effective, district-wide MTSS
- School Climate & Culture Create a safe, supportive learning environment
- Positive Behavior Interventions & Supports Promote positive behavior and climate
- Family Engagement Engage families as partners in education
- Platform Holistic data and student support tools
- Integrations Daily syncs with district data systems and assessments
- Professional Development Strategic advising, workshop facilitation, and ongoing support
- Success Stories
- Surveys and Toolkits
- Product Demos
- Events and Conferences
.png "quantitative case study survey")
2024 State of Chronic Absenteeism Report
Explore what millions of students tell us about the link between school climate and chronic absenteeism.
- Connecticut
- Massachusetts
- Mississippi
- New Hampshire
- North Carolina
- North Dakota
- Pennsylvania
- Rhode Island
- South Carolina
- South Dakota
- West Virginia
- Testimonials
- About Panorama
- Data Privacy
- Leadership Team
- In the Press
- Request a Demo

- Popular Posts
- Multi-Tiered System of Supports
- Family Engagement
- Social-Emotional Well-Being
- College and Career Readiness
Show Categories
School Climate
The ultimate guide to k-12 feedback surveys.

Sam DeFlitch

Understanding the experiences and perceptions of students, families, and staff is more critical than ever. District leaders face unprecedented challenges, from addressing chronic absenteeism to closing learning gaps that have widened over the past few years. By tapping into the voices of students, families, and staff, districts can better understand and respond to these critical issues, ensuring that the needs of the community inform every decision.
To gather this authentic, actionable feedback from their community, many districts are turning to feedback surveys . Feedback surveys are essential for gathering valuable insights that can drive meaningful improvements in schools and districts. By collecting and analyzing feedback, educational leaders can make informed decisions that enhance student outcomes, foster a positive school climate , and build stronger community partnerships.
Whether you’re looking to start a new survey program or enhance an existing one, this guide will walk you through every step , from understanding the importance of feedback surveys to leveraging the data for continuous improvement.
We'll explore the key elements of successful survey programs, provide practical tips for creating and running surveys, and offer strategies for analyzing and using the collected data. Additionally, you'll find inspiring case studies from districts that have successfully harnessed the power of feedback surveys to drive positive change.
Table of Contents
Why Are Feedback Surveys Important?
Elements of an effective survey program, how to create and run a survey program, analyzing your survey data, how to use the survey data, case studies of top-notch survey programs, next steps for school & district leaders, importance of gathering feedback.
Feedback surveys play a pivotal role in a district’s continuous improvement process. By gathering input from students, families, and staff, schools and districts can gain a deeper understanding of their needs, experiences, and perceptions. This valuable information is crucial for several reasons:
Enhancing Student Engagement and Learning Outcomes: Feedback from students helps educators understand what is working and what isn't in the classroom. This understanding can lead to adjustments in teaching methods, curriculum design, and support services, ultimately boosting student engagement and academic performance.
Valuing Student Voice: When students feel their voices are being heard —and acted on—their connection to school strengthens. That increased engagement can make a big difference on attendance, academic performance, and student behavior.
Building Stronger Relationships With Families: Surveys provide a platform for families to voice their opinions and concerns . They foster a sense of inclusion and partnership, creating a more collaborative and supportive school community.
Listening and Responding to Teacher and Staff Needs: When gathered regularly, feedback from teachers and staff can help administrators prioritize supports, deliver targeted professional development, and create a more positive working environment that benefits both adults and students.
Informing Decision-Making Processes: Data from feedback surveys offers a solid foundation for making informed decisions at both the school and district levels. This foundation ensures that policies and initiatives are grounded in real-world insights and address the actual needs of the community.

Panorama Student Survey (demo data displayed)
Benefits of Feedback Surveys
Implementing a robust feedback survey program offers a range of benefits that contribute to overall school and district success:
Identifying Areas of Improvement: Surveys help identify specific areas where schools and districts can enhance their practices. Whether it's improving classroom instruction, student services, or school facilities, feedback provides actionable insights for targeted interventions.
Recognizing Successes and Best Practices: Feedback isn't just about highlighting problems but also about recognizing what works well. Celebrating successes and best practices can boost morale, encourage positive behaviors, and serve as models for other buildings.
Promoting a Culture of Continuous Improvement: Regularly seeking and acting on feedback demonstrates a commitment to continuous improvement. This culture encourages everyone in the school community to strive for excellence and remain adaptable to changing needs and challenges.
By understanding the importance and benefits of feedback surveys, educational leaders can create more responsive and effective educational environments. In turn, improved learning environments lead to better student outcomes, greater satisfaction among families and staff, and stronger, more cohesive school communities.
Clear Objectives
An effective survey program starts with clear objectives. Establishing what you want to achieve with your survey ensures that your questions are focused and relevant, leading to actionable insights for your district.
Setting Goals: Begin by determining the specific outcomes you want from the survey. Are you aiming to improve student engagement, enhance teacher performance, or increase family engagement ? Clear goals help guide the entire survey process.
Aligning With Priorities: Ensure your survey goals align with district and school priorities. When survey objectives are in sync with broader educational goals, it becomes easier to gain support from stakeholders and integrate survey results into strategic planning.
Survey Design
The design of your survey significantly impacts the quality and usability of the data collected. A well-designed survey can lead to high response rates and reliable data.
Crafting Questions: Use clear, concise, and unbiased language in your questions, and consider the reading level of participants taking the survey. Avoid leading or loaded questions that might skew the responses. Include a mix of open-ended and closed-ended questions to capture both quantitative and qualitative data. Open-ended questions provide rich, detailed feedback, while closed-ended questions are easier to analyze statistically.
Inclusivity and Accessibility: Ensure that the survey is accessible to all respondents. Make accommodations for respondents with disabilities and provide translations for non-native English speakers. Consider cultural differences and ensure questions are respectful and inclusive, promoting honest and diverse feedback.
Selecting Topics: Knowing which survey topics are correlated with broader concerns and goals—such as attendance or academic success—is key to developing an actionable survey. Aligning survey content with goal setting or strategic planning helps ensure the data gathered are as impactful as possible. At Panorama , we recommend selecting five to seven topics per survey. By selecting the right number of topics, you can ensure the survey aligns with your district’s goals.
Using Valid and Reliable Survey Instruments: Validity and reliability are two key attributes of a strong survey instrument, ensuring that the data collected is accurate, consistent, and actionable. Validity refers to whether a survey measures what it is supposed to measure. Reliability, on the other hand, refers to the consistency of the survey results over time or across different groups of respondents. A reliable survey provides stable and consistent data when administered under similar conditions. Together, validity and reliability are essential for making informed, data-driven decisions.
Frequency and Timing
The timing and frequency of your surveys can affect response rates and the quality of feedback.
Optimal Timing: Choose a time that is convenient for respondents, avoiding busy periods like the start or end of the school year. Mid-semester or mid-year often works well, as it provides a balance between respondents being settled in and avoiding end-of-period stress.
Balancing Frequency: Avoid survey fatigue by spacing out surveys and only conducting them as frequently as necessary to gather meaningful data. Over-surveying can lead to lower response rates and less thoughtful feedback. A well-timed annual or bi-annual survey can be effective, supplemented with occasional shorter, targeted surveys or Check-Ins .
By focusing on these elements, you can design an effective survey program that yields high-quality, actionable data. Clear objectives, thoughtful survey design, and appropriate timing ensure that your feedback process is both efficient and impactful, providing valuable insights to drive continuous improvement in your school or district.
Planning Your Survey
A well-planned survey program ensures a smooth implementation and high response rates . By addressing the key elements of planning, you can set your survey up for success.
Identifying Stakeholders : Determine who will be involved in the survey process. Include those who will design, distribute, and analyze the survey. Engage a diverse group of stakeholders, such as administrators, teachers, students, and parents, to ensure the survey addresses various perspectives and needs. Identify the target respondents. Decide whether your survey will target students, families, staff, or a combination of these groups . Tailoring your survey to specific audiences ensures that the questions are relevant and meaningful to the respondents.
Selecting Tools : Choose the right platform and tools for survey creation and distribution. Look for features like anonymity, easy data export, user-friendly interfaces, and the ability to handle various question types. Popular survey tools include SurveyMonkey, Google Forms, and the Panorama survey platform , which we’ve designed specifically for educational settings.
Communication Strategy
Effective communication encourages participation by ensuring respondents understand the purpose of the survey. A well-executed communication plan can significantly boost response rates and the quality of feedback.
Promoting the Survey: Use multiple channels to promote the survey. Consider emails, newsletters, school websites, social media, and in-person announcements. Clearly communicate the purpose of the survey and how you will use the feedback to make improvements. Consider personalizing invitations when possible—this can increase engagement by making respondents feel that their input is valued.
Providing Instructions : Offer clear instructions on how to complete the survey, including deadlines and any necessary technical support. Make sure respondents know how to access the survey and who to contact if they encounter any issues. Emphasize the importance of honest and thoughtful feedback. Assure respondents that their responses will be confidential and will be used to make meaningful improvements.
Implementation
Smooth implementation ensures high participation rates and quality data collection. By paying attention to logistical details, you can create a seamless survey experience for respondents.
Administering the Survey: Distribute the survey efficiently, ensuring all targeted respondents receive it. Use email lists, student portals, and other reliable distribution methods. Provide reminders as the deadline approaches to encourage participation. Provide support for respondents who may need help completing the survey. This support can include technical assistance, language translation services, and accommodations for respondents with disabilities.
Ensuring Privacy : Protect respondent confidentiality and ensure that data is securely stored and handled. Use encryption and other security measures to safeguard survey responses. Clearly communicate your privacy policies to reassure respondents that you will protect their data. An onymize responses where appropriate to encourage honest and candid feedback. Assure respondents that you will not be able to trace their responses back to them unless they choose to provide their identity.
By carefully planning and effectively communicating and implementing your survey, you can maximize participation and collect high-quality data. These steps are crucial for creating a survey program that provides valuable insights and drives positive change in your school or district.
Data Collection
Efficient data collection methods are essential for organizing responses and ensuring the data is ready for analysis.
- Organizing Responses : Use technology to gather and organize survey responses automatically. Many survey platforms offer built-in tools for data collection and initial organization, making it easier to handle large volumes of data. Ensure data is cleaned and prepared for analysis. This process includes checking for duplicate responses, incomplete submissions, and other inconsistencies that might affect the quality of the data.
Data Analysis Techniques
Proper analysis techniques are crucial for extracting meaningful insights from survey data. Use both quantitative and qualitative methods to provide a comprehensive understanding of the feedback.
- Use statistical methods to analyze closed-ended questions. Calculate averages, percentages, and distributions to identify trends and patterns. Tools like Excel, Google Sheets, or specialized survey software can help with this.
- Look for correlations and significant differences in responses among different groups. These can help identify specific areas of concern or success among various demographics, such as grade levels, departments, or student groups.
- Panorama’s Student Survey offers normed scoring , which compares student scores to a national reference group. This method contextualizes individual student performance by showing how students fare relative to their peers at the same grade level.
- Normed scoring provides a deeper understanding of student performance by comparing individual scores to class or grade averages. It also allows for reliable comparisons across different grade levels and topics, ensuring confidence in the analysis. Additionally, normed scoring supports comprehensive assessment of strengths and areas for improvement, aiding in district strategic planning and school improvement.
- Analyze open-ended responses for themes and insights. This analysis involves coding the responses to identify common themes, sentiments, and key phrases.
- Identify quotes and anecdotes that illustrate broader trends. These qualitative insights provide context and depth to the quantitative data, offering a richer understanding of the respondents' perspectives.
- Panorama AI offers several features to boost your district’s qualitative analysis of student responses. For example, Panorama Signal rapidly sorts hundreds of thousands of Survey responses to identify sensitive content. This data includes references to self-harm, abuse, threats to others, bullying, personally identifiable information, and inappropriate language. That means administrators and educators can take immediate action for students in need.
- Additionally , Panorama Response Recap synthesizes all of your free responses to instantly identify what’s important to your district and school community. Identify positive, neutral, and negative themes, and then double-click into each theme to read through the responses.

Panorama Response Recap (demo data displayed)
Reporting and Visualization
Clear reporting and visualization make it easier to communicate findings to stakeholders and ensure the data is actionable.
- Develop concise and actionable reports that highlight key findings and recommendations. Structure your reports to address the main objectives of the survey and provide clear answers to the questions posed.
- Include an executive summary that presents the most important insights in a brief, easily digestible format. This summary helps busy stakeholders quickly grasp the main points.
- Use charts, graphs, and other visualization tools to make data more accessible and understandable. Visual representations can help highlight trends, comparisons, and significant findings in a way that is easy to interpret.
- Tailor visualizations to your audience. Ensure that the chosen formats are suitable for the intended stakeholders, whether they are educators, administrators, parents, or students.
By effectively collecting, analyzing, and reporting your survey data, you can transform raw feedback into actionable insights. This process is crucial for understanding the needs and perspectives of your school community and making informed decisions that drive continuous improvement.
Data Inquiry Strategies
Now that your team has prepared to engage with the data, it's time to review the survey results and interpret survey data so your school and district teams can make data-informed decisions. There are many different strategies for interpreting survey data. Panorama Playbook , for example, provides a number of ways to view and interpret data, both through inquiry and elevating student voices:
Ladder of Inference: As you prepare to review the data, take a moment to familiarize yourself with the ladder of inference . Popularized by Peter Senge's The Fifth Discipline , the ladder of inference is a mental model for reducing bias while understanding and analyzing data. The key is to climb slowly up the ladder of inference, spending more time observing the data. Then, consider alternative explanations in the data before deciding what it means and choosing a course of action.
Aspirations & Apprehensions: While feedback data is an informative tool for improving practice, the process of reflecting on results can sometimes be challenging or uncomfortable. Acknowledging and sharing our aspirations and apprehensions for using student feedback can set the stage for the most positive and productive action planning. This strategy guides educators through the process of reflecting on student voice data in an objective and asset-based manner.
Action Planning
Turning survey insights into action plans ensures that feedback leads to tangible improvements. An effective action plan prioritizes areas of focus and outlines clear steps to address identified issues.
Create detailed action plans based on survey findings. Begin by identifying key areas that need improvement and setting specific, measurable goals for each area. Break down these goals into actionable steps that you can implement over time.
Prioritize actions based on impact and feasibility. Focus first on changes that will have the most significant positive effect and that you can realistically achieve within your resources and timeline.
Establish realistic timelines for implementing changes and improvements. Clearly define start and end dates for each action step and ensure that you communicate timelines to all stakeholders involved.
Monitor progress against these timelines regularly to keep the action plan on track. Be sure to allow for adjustments as needed to address any challenges that arise.
Engaging Stakeholders
Involving stakeholders in the process fosters a sense of ownership and collaboration. Effective engagement ensures that the survey data informs decisions and reflects the needs and perspectives of the entire school community .
Communicate survey results with students, families, and staff through meetings, reports, and presentations. Transparency in sharing results builds trust and demonstrates a commitment to using feedback for improvement.
Use different formats to reach diverse audiences. Consider including visual presentations for meetings, detailed written reports, or summary emails and newsletters.
Work with stakeholders to develop solutions and strategies based on survey feedback. Engage teachers, students, parents, and other community members in brainstorming sessions, focus groups, and workshops to co-create action plans.
Encourage open dialogue and input. Make it clear that you value all voices and that the goal is to create collaborative solutions that benefit the entire school community.
Continuous Improvement
Incorporating feedback into a continuous improvement cycle ensures ongoing progress and adaptation. Regularly reviewing and acting on survey data helps maintain a culture of excellence and responsiveness.
Regularly check the progress of action plans and adjust strategies as needed. Use follow-up surveys, check-ins, and progress reports to evaluate the effectiveness of implemented changes and to identify any new issues that may arise.
Celebrate successes and milestones. Recognizing and rewarding progress helps maintain motivation and demonstrates the positive impact of feedback-driven improvements.
Use feedback surveys as an ongoing tool for continuous improvement. Regularly update and refine your survey approach to ensure it remains relevant and effective in capturing the most important data.
Incorporate feedback cycles into your regular planning processes. Make surveys a routine part of evaluating programs, initiatives, and overall school performance, ensuring that you continuously gather and act on valuable insights.
By effectively using survey data, schools and districts can drive meaningful improvements that enhance educational outcomes and foster positive, responsive school environments. Action planning, stakeholder engagement, and a commitment to continuous improvement ensure that the insights gained from surveys lead to tangible benefits for students, families, and staff.
Fostering Growth Mindset at a 2023 Blue Ribbon School: How Maunawili Closed the Achievement Gap : Learn how Maunawili Elementary, a 2023 National Blue Ribbon School in Kailua, Hawaii, closed the achievement gap and improved students’ sense of belonging by 17 points.
Using Panorama Surveys to Empower Students at Highline Public Schools : Highline Public Schools , located just outside of Seattle in Burien, WA, serves a diverse population of 18,000 students in 34 schools. Learn how district leaders use student voice data to empower and engage students as co-creators of a new SEL program.
How Gadsden ISD Uses Student Voice to Adopt New Mexico’s MLSS Framework : Learn how Gadsden Independent School District—a district of 28 schools and 12,620 students—uses student voice data to inform and implement their MLSS.
How Feedback Surveys Helped La Cañada Unified School District Significantly Improve Communication With the Community: Five years ago, the community and Board of Education wanted access to more data, more communication, and greater transparency from LCUSD. Today, 85% of the community report satisfaction with communication from the district. Over 90% of parents of students in grades 7-12 would recommend LCUSD to other families.
Feedback surveys are a powerful tool for driving positive change in schools. By systematically gathering and analyzing feedback from students, families, and staff, schools and districts can make informed decisions that enhance educational outcomes, foster a supportive environment, and build stronger community relationships.
We’re excited for you to use the knowledge and tools in this guide to design, implement, and utilize feedback surveys effectively. We know your efforts will ensure continuous improvement and growth for all.
If your school or district is searching for a surveys platform, consider Panorama Surveys and Feedback . Panorama Surveys and Feedback is the leading K–12 platform for all your district's survey needs, from benchmark surveys to pulse checks. Panorama is the central place for districts to collect and analyze student, family, and teacher feedback on the factors that are critical to student achievement. With reliable, actionable feedback data, districts can address key issues like belonging, teacher-student relationships, engagement, and school safety.
Designed by an expert research team, Panorama’s reporting platform is based on a robust dataset of over 1.5 billion responses to our surveys—the largest dataset of its kind. This provides powerful benchmarking, such as insight into how your students compare to their peers and how your school or district compares to other similar communities.
Watch a Free Demo of Panorama Surveys and Feedback
Related Articles

21 Survey Questions to Ask to Understand School Climate
Learn how to use a school climate survey to measure, understand, and act on the feedback from students, families, and staff in your school.

4 Keys for Effective Community Surveys
In this post, we’ll detail how districts can collect high-quality feedback by using community surveys.

La Cañada Shares Survey Results
La Cañada Unified School District, Panorama's first client, shares results from its surveys, used to collect feedback from students, families, and staff.
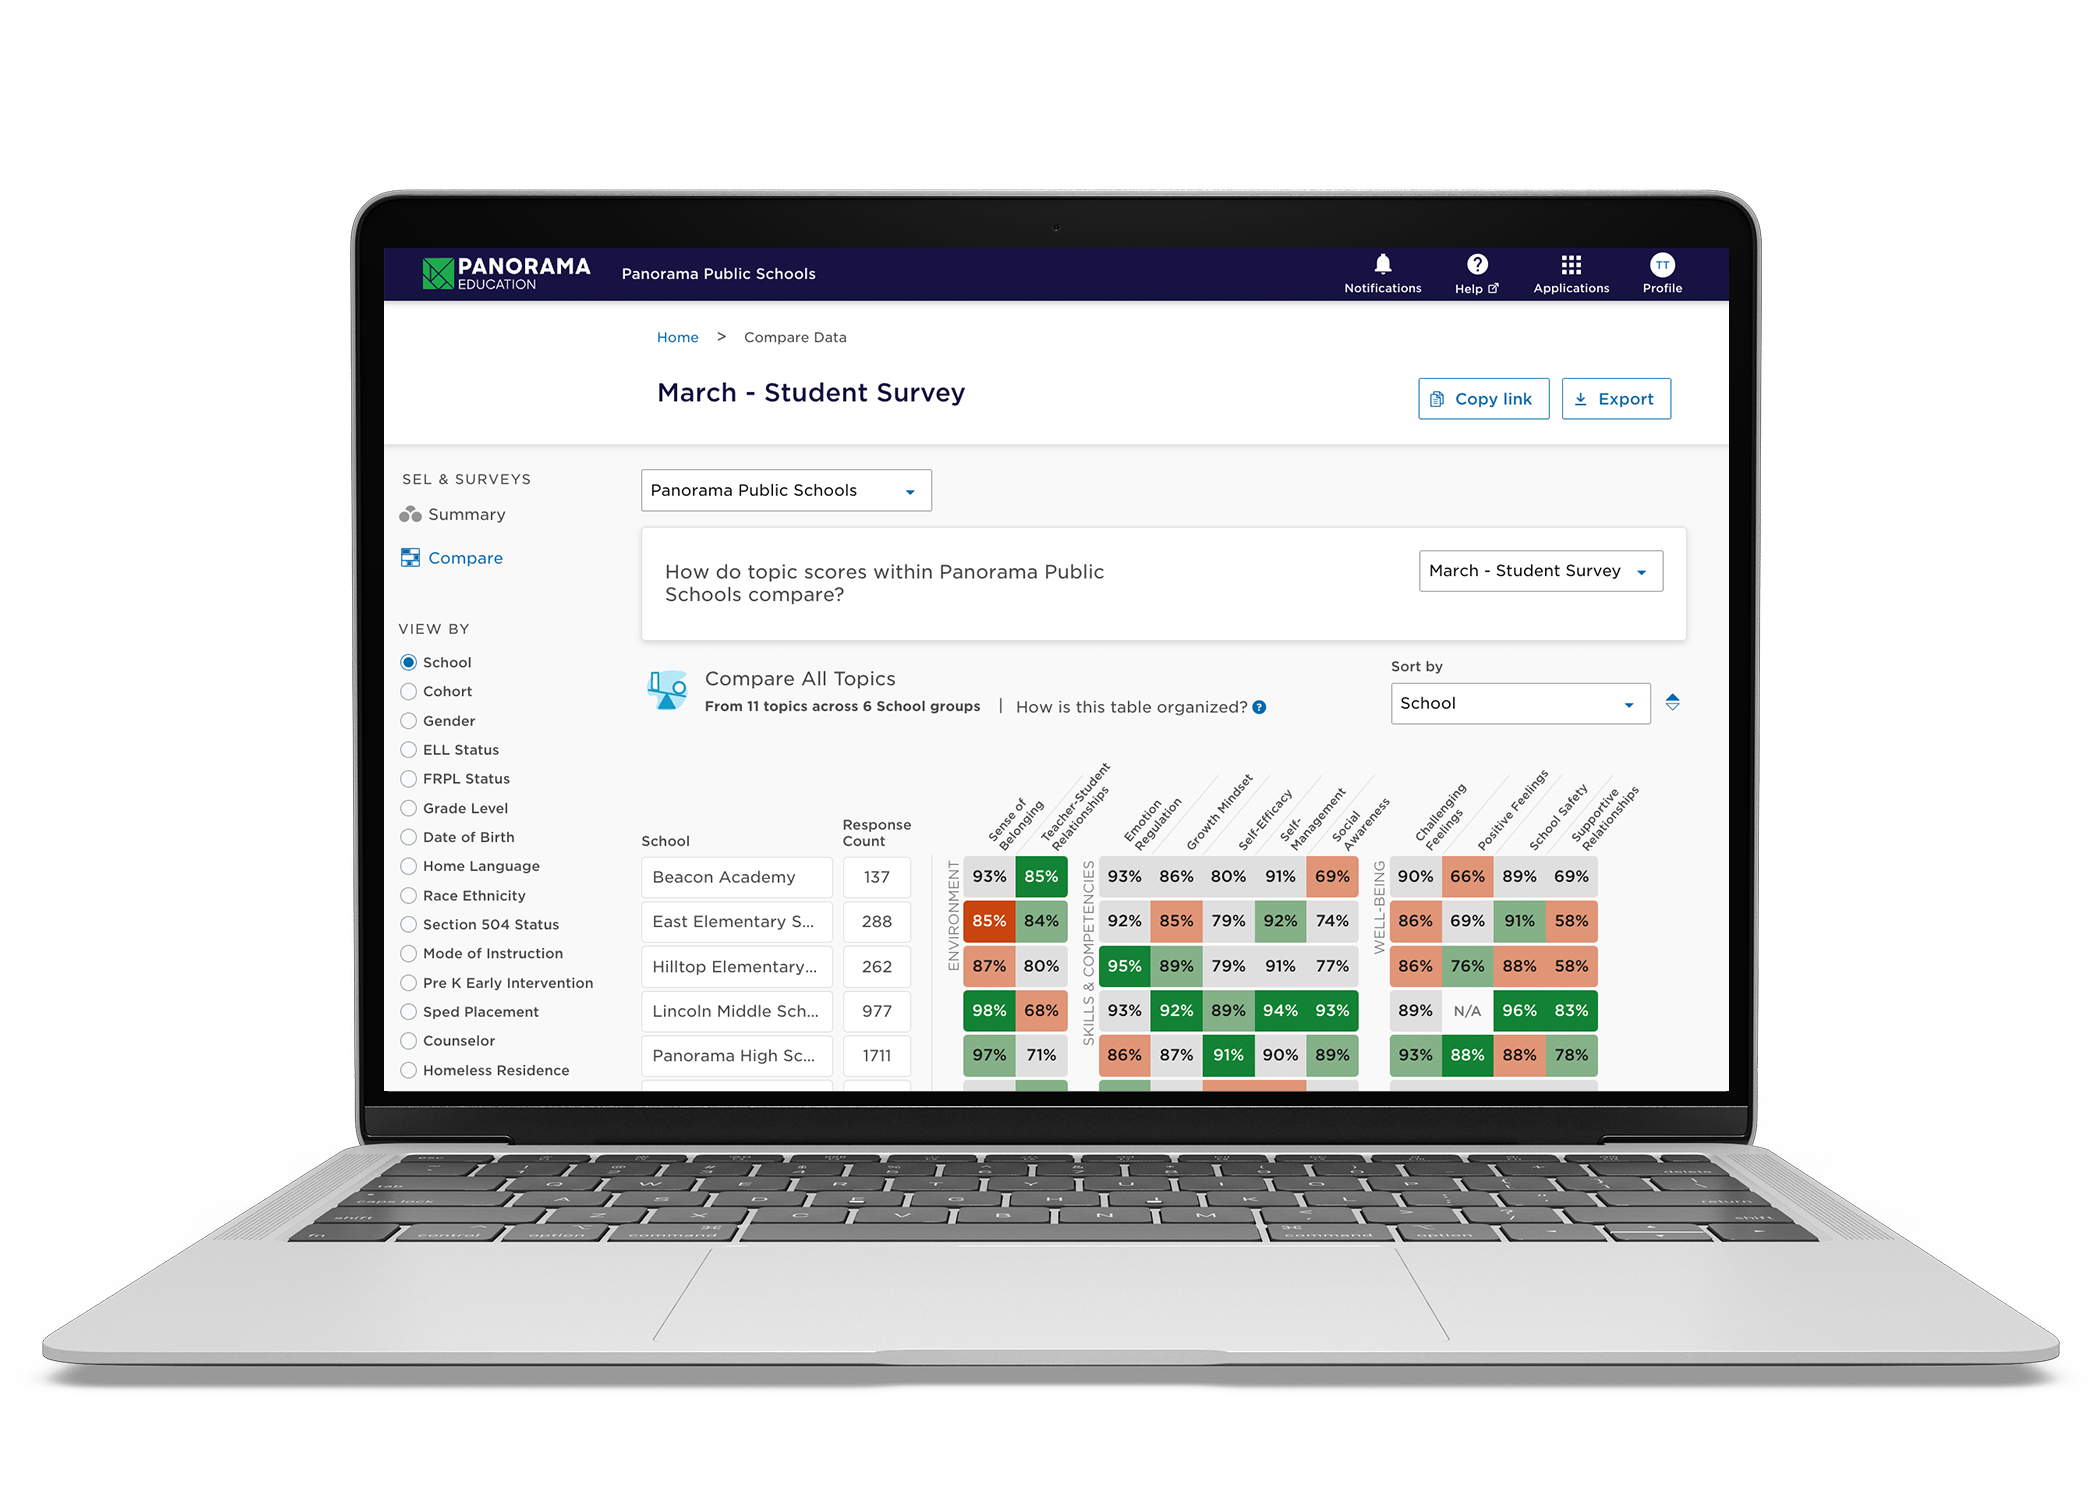
On-Demand Demo
Discover panorama surveys and feedback.
Learn how Panorama Surveys and Feedback can help you gather critical feedback from your community at scale and get actionable insights faster.
Join 90,000+ education leaders on our weekly newsletter.
Numbers, Facts and Trends Shaping Your World
Read our research on:
Full Topic List
Regions & Countries
- Publications
- Our Methods
- Short Reads
- Tools & Resources
Read Our Research On:
Americans’ views of offensive speech aren’t necessarily clear-cut
About six-in-ten U.S. adults (62%) say that “people being too easily offended by things others say” is a major problem in the country today.
In a separate question, 47% say that “people saying things that are very offensive to others” is a major problem, according to a Pew Research Center survey conducted in April.
Pew Research Center conducted this analysis to understand Americans’ views on whether offensive speech – and people being too easily offended by what others say – are major problems for the country. For this analysis, we surveyed 8,709 U.S. adults from April 8 to 14, 2024.
Everyone who took part in this survey is a member of the Center’s American Trends Panel (ATP), an online survey panel that is recruited through national, random sampling of residential addresses. This way nearly all U.S. adults have a chance of selection. The survey is weighted to be representative of the U.S. adult population by gender, race, ethnicity, partisan affiliation, education and other categories. Read more about the ATP’s methodology . Here are the questions used for this analysis , along with responses, and its methodology .

There are substantial differences in these views between Republicans and Democrats.
- Eight-in-ten Republicans and Republican-leaning independents say people being too easily offended by what others say is a major problem. By comparison, 45% of Democrats and Democratic leaners say the same.
- In contrast, Democrats are more likely than Republicans to say that people saying things that are very offensive is a major problem in the country today. A 59% majority of Democrats say this, compared with 34% of Republicans.
Looking at Americans’ views on these two questions together, about a third (32%) say that people being too easily offended by things others say and people saying very offensive things to others are both major problems.

About as many Americans (30%) say people taking offense too easily is a major problem, but very offensive speech is not. A much smaller share (15%) say that people saying very offensive things is a major problem, but people too easily taking offense isn’t. And another 23% say that neither is a major problem in the country.
Sizable shares within both parties say both issues are major problems – 30% of Republicans and 32% of Democrats say this.
However, half of Republicans, compared with just 12% of Democrats, say people being too easily offended is a major problem, but people saying very offensive things isn’t. Slightly more than half of conservative Republicans (53%) hold this combination of views, along with 44% of moderate and liberal Republicans.
By contrast, about a quarter of Democrats (26%) – and a third of liberal Democrats – say people saying very offensive things is a major problem, but people being too easily offended is not. Just 4% of Republicans hold this combination of views.
Another 29% of Democrats, but just 15% of Republicans, say neither of these is a major problem.
There are also significant demographic differences in attitudes about offensive speech.
Race and ethnicity

While at least half of Americans across racial and ethnic groups say being too easily offended is a major problem in the country, White adults are particularly likely to say this. Nearly two-thirds of White adults (65%) say this is a major problem, as do 59% of Hispanic, 59% of Asian and 50% of Black adults.
No more than about one-in-ten in any of these groups say people getting offended too easily is not a problem in the country today.
Conversely, Black (63%), Asian (58%) and Hispanic (55%) adults are more likely than White adults (42%) to say that people saying very offensive things to others is a major problem.
Men (62%) and women (63%) are about equally likely to say people being too easily offended is a major problem.
But women (54%) are far more likely than men (40%) to say offensive speech is a major problem.
Within political parties, there are some differences by gender, race and ethnicity on these questions.
On whether people being too easily offended is a major problem:
- Hispanic Republicans (71%) are less likely than White Republicans (83%) to say this is a major problem. (The sample size for Black and Asian Republicans is too small to evaluate these groups individually.)
- There are no gaps between men and women in either party.
On whether offensive speech is a major problem:
- Democratic and Republican women are more likely than men in their parties to say offensive speech is a major problem. Among Democrats, 63% of women and 54% of men say this. And in the GOP, 43% of women and 27% of men say the same.
- While roughly two-thirds of Black (67%), Hispanic (65%) and Asian Democrats (64%) say this is a major issue, a narrower majority of White Democrats (54%) share that view.
Note: This is an update of a post originally published Dec. 14, 2021. Here are the questions used for this analysis , along with responses, and its methodology .
- Discrimination & Prejudice
- Free Speech & Press
- Political Ideals & Systems

J. Baxter Oliphant is a senior researcher focusing on politics at Pew Research Center .
Many adults in East and Southeast Asia support free speech, are open to societal change
Americans’ views of technology companies, most americans say a free press is highly important to society, most americans favor restrictions on false information, violent content online, freedom of speech and lgbt rights: americans’ views of issues in supreme court case, most popular.
901 E St. NW, Suite 300 Washington, DC 20004 USA (+1) 202-419-4300 | Main (+1) 202-857-8562 | Fax (+1) 202-419-4372 | Media Inquiries
Research Topics
- Email Newsletters
ABOUT PEW RESEARCH CENTER Pew Research Center is a nonpartisan fact tank that informs the public about the issues, attitudes and trends shaping the world. It conducts public opinion polling, demographic research, media content analysis and other empirical social science research. Pew Research Center does not take policy positions. It is a subsidiary of The Pew Charitable Trusts .
© 2024 Pew Research Center
More From Forbes
The roi of executive coaching: a comprehensive guide.

- Share to Facebook
- Share to Twitter
- Share to Linkedin
Melanie Espeland is an Executive Coach of Espeland Enterprises , an authority in executive presence, voice, and executive life coaching.
The numbers don't lie: The International Coaching Federation (ICF), in partnership with PwC, estimated global coaching revenue in 2019 to be $2.849 billion —a 21% increase from 2015—and a practitioner growth of 33% from 2015.
What's more, a report from management consulting and investment banking firm FMI found that 87% of survey respondents agreed that executive coaching has a high return on investment (ROI). With coaching growing at double-digit speed, today's leaders must understand how to measure its return on investment.
Calculating The ROI Of Executive Coaching
The methodology used herein is for executive coaching, or coaching clients in professional industries. Executive coaching can include sales coaching, business coaching, leadership coaching, self-awareness coaching and more. However, the same philosophy could be used to measure the average ROI of coaching more generally, such as for life coaching.
You can calculate the specific ROI for your project using three pillars:
1. Quantitative Value
A. Pick a lever.
One coaching engagement may have quantitative results across multiple levers. You can quantify the value of coaching across various levers, such as increased revenue, increased productivity, higher customer satisfaction, increased retention, etc.
B. Estimate initial impact via internal data and past outcomes.
For example, let's say your organization is going to invest in coaching for specific skills leading to tangible results for 1,000 employees. Your executive coach has seen an average 10% reduction in turnover for three years as a result of this coaching. If the average recruitment, interviewing and onboarding cost is $10,000 per job opening, then you will save as follows:
1,000 employees * 10% reduced turnover = 100 retained employees
100 retained employees * $10,000 saved onboarding cost = $1,000,000 saved annually
$1,000,000 annually * 3 years = $3,000,000 saved via reduced turnover
C. Adjust the impact.
You can estimate a value for the percent share of the coaching's contribution toward the quantitative outcome (i.e., savings from reducing turnover). This contribution may be shared with various relevant factors, such as the coach's experience and track record, the anticipated level of effort given by employees and the difficulty of the actual training. Additional adjustments or confidence intervals can be added as needed.
$3,000,000 saved over 3 years * 50% for the coaching engagement's contribution to the results = $1,500,000 adjusted value
D. Calculate the ROI.
Take the adjusted value and subtract the total cost of the coaching to get your final ROI.
$1,500,000 adjusted value - $250,000 coaching engagement investment = $1,250,000 ROI of executive coaching realized
2. Qualitative Value
Thinking beyond the quantitative to intangible benefits is a key factor in calculating coaching ROI. In fact, it can often be the cause of financial performance improvement. For example, coaching engagements can have the following qualitative impact:
• Improved relationships with direct reports, peers and other key stakeholders
• Increased commitment to the organization
• Increased job satisfaction
This leads to:
• Increased revenue
• Increased productivity
• Higher customer satisfaction
• Reduced turnover
It may be helpful to start with the estimated qualitative value in order to estimate the quantitative business results. For example, your coach may note that they see an average 40% improvement in executive presence in their clients. If employees have a newfound leadership capacity and better communication, it logically follows that this increased self-esteem would lead to better work performance and overall productivity. Perhaps a 40% improvement in executive presence translates to a 2% improved performance. Multiply 2% by your annual revenue to have a directionally accurate impact (i.e., step 1B).
Lastly, consider proactively measuring your quantitative ROI through self-assessment. Effective leaders understand the importance of feedback and active listening. Have surveys and open forums for employees to articulate and rate their coaching experience. Take the average of the cumulative scores and comments in order to understand the value of your coaching program in real time.
3. Consequences (If Not Pursued)
Wins or gains are certainly motivating, but even more important to leaders, organizations and shareholders is avoiding loss. Thus, it is significant to consider the consequences of not pursuing coaching. For example:
• Less relevant skill sets in the employee population
• Decreased productivity due to a lack of development opportunities
• Decreased employee satisfaction
• Lower customer satisfaction
• Increased turnover, leading to additional costs and loss of productivity
• Lower revenue
In the illustrative example used earlier, the benefit explored of executive coaching was reduced turnover through employee engagement. In this case, a potential consequence of forgoing the initial investment of coaching could be increased turnover through a lack of emotional intelligence in the organization, or a brain drain of leadership competencies. If a lack of professional development opportunities led to just a 1% decrease in employee satisfaction, then this consequence could be quantified via each team's contribution to the P&L.
The Bottom Line
Overall, the benefits and ROI of executive coaching have been proven through various research studies, including Harvard Business Review 's findings on financial performance in the stock market . While the need for calculating tangible ROI is obvious, it is clear that ROI extending to qualitative and emotional attributes (such as a nuanced leadership style) is not to be taken lightly. These qualitative levers connect to the return on investment seen in the bottom line.
It is important to note that not all coaching engagements have the same outcome, and results may vary depending on factors such as the coach's qualifications and experience, the individual's willingness to change and the specific goals of the coaching. Therefore, when considering investing in coaching, it is important to do thorough research and choose a coach who is well-suited to the specific needs of the individual or organization.
Forbes Coaches Council is an invitation-only community for leading business and career coaches. Do I qualify?

- Editorial Standards
- Reprints & Permissions
Information
- Author Services
Initiatives
You are accessing a machine-readable page. In order to be human-readable, please install an RSS reader.
All articles published by MDPI are made immediately available worldwide under an open access license. No special permission is required to reuse all or part of the article published by MDPI, including figures and tables. For articles published under an open access Creative Common CC BY license, any part of the article may be reused without permission provided that the original article is clearly cited. For more information, please refer to https://www.mdpi.com/openaccess .
Feature papers represent the most advanced research with significant potential for high impact in the field. A Feature Paper should be a substantial original Article that involves several techniques or approaches, provides an outlook for future research directions and describes possible research applications.
Feature papers are submitted upon individual invitation or recommendation by the scientific editors and must receive positive feedback from the reviewers.
Editor’s Choice articles are based on recommendations by the scientific editors of MDPI journals from around the world. Editors select a small number of articles recently published in the journal that they believe will be particularly interesting to readers, or important in the respective research area. The aim is to provide a snapshot of some of the most exciting work published in the various research areas of the journal.
Original Submission Date Received: .
- Active Journals
- Find a Journal
- Proceedings Series
- For Authors
- For Reviewers
- For Editors
- For Librarians
- For Publishers
- For Societies
- For Conference Organizers
- Open Access Policy
- Institutional Open Access Program
- Special Issues Guidelines
- Editorial Process
- Research and Publication Ethics
- Article Processing Charges
- Testimonials
- Preprints.org
- SciProfiles
- Encyclopedia
Article Menu

- Subscribe SciFeed
- Recommended Articles
- Author Biographies
- Google Scholar
- on Google Scholar
- Table of Contents
Find support for a specific problem in the support section of our website.
Please let us know what you think of our products and services.
Visit our dedicated information section to learn more about MDPI.
JSmol Viewer
Towards the wall or the bridge a case study of host–guest symbiosis in a chinese heritage tourism site.

1. Introduction
2. literature review, 2.1. what is going on inside heritage tourist destinations as a symbiotic system, 2.2. who plays the role host–guest interaction in heritage tourism destinations, 2.3. how does symbiosis proceed a symbiosis framework for heritage tourist destinations based on host–guest interactions, 3. hypotheses development, 3.1. emotional solidarity and the sense of community belonging, 3.2. the sense of community belonging and willingness to participate in tourism, 4. materials and methods, 4.1. study area, 4.2. data sources and methodology, 4.2.1. stage i qualitative, 4.2.2. stage ii quantitative, 5.1. stage i, 5.1.1. identity qualification.
Every household starts stocking up on fish and ingredients to make crispy fish after 1 October, with too much work to do to prepare it for sale at the end of the year. (V02)
While ancient cities exist worldwide, Guangfu is the only one combining the water culture and Tai Chi culture. There are many young and older people playing Tai Chi at 5 o’clock, Foreigners also learn to play Tai Chi ( Figure 5 ). (V01)
Click here to enlarge figure
We don’t do the specialties such as crispy fish, as there are too many people doing it, and the competition is fierce. (V11)
5.1.2. Bodily Co-Presence
- From 6 a.m. to 8 a.m., most of the shops on the main commercial streets are not open for business, with almost no interaction between residents and tourists, presenting an ordinary scene of Guangfu;
- From 4 p.m. to 6 p.m., a number of tourists and residents go out for activities, and it is the peak period for great interaction between residents and tourists.
- After 8 p.m., residents start to rest and are less active. Most tourists are day-trippers and rarely stay overnight, so residents and tourists seldom have interactions.
5.1.3. Common Focus
5.2. stage ii, 5.2.1. sample description, 5.2.2. reliability test and cfa, 5.2.3. the results of hypothesis testing, 6. discussion, 6.1. theoretical implications, 6.2. practical implications, 7. conclusions, author contributions, data availability statement, acknowledgments, conflicts of interest.
- Cho, H.D. Relationship between tourism and heritage from a tourist perspective: Synergy, complementarity and antagonism. Curr. Issues Tour. 2021 , 25 , 1557–1569. [ Google Scholar ] [ CrossRef ]
- Loulanski, T.; Loulanski, V. The sustainable integration of cultural heritage and tourism: A meta-study. J. Sustain. Tour. 2011 , 19 , 837–862. [ Google Scholar ] [ CrossRef ]
- Giliberto, F.; Labadi, S. Re-imagining heritage tourism in post-COVID Sub-Saharan Africa: Local stakeholders’ perspectives and future directions. Sustainability 2023 , 15 , 4339. [ Google Scholar ] [ CrossRef ]
- Tsai, S.P. Augmented reality enhancing place satisfaction for heritage tourism marketing. Curr. Issues Tour. 2019 , 23 , 1078–1083. [ Google Scholar ] [ CrossRef ]
- Jiang, S.; Moyle, B.; Yung, R.; Tao, L.; Scott, N. Augmented reality and the enhancement of memorable tourism experiences at heritage sites. Curr. Issues Tour. 2022 , 26 , 242–257. [ Google Scholar ] [ CrossRef ]
- Ji, F.; Wang, F.; Wu, B. How does virtual tourism involvement impact the social education effect of cultural heritage? J. Destin. Mark. Manage. 2023 , 28 , 100779. [ Google Scholar ] [ CrossRef ]
- Allaberganov, A.; Catterall, P. Using social exchange theory to examine residents’ responses to heritage tourism: Case studies of Samarqand and Bukhara in Uzbekistan. J. Herit. Tour. 2023 , 18 , 846–863. [ Google Scholar ] [ CrossRef ]
- Qu, C.; Zhang, C.; Shen, S.; Olsen, D.H. Heritage conservation and communities’ sense of deprivation in tourism: The case of the Hani community in Yunnan, China. Tour. Geogr. 2022 , 25 , 881–898. [ Google Scholar ] [ CrossRef ]
- Liu, Y.; Wang, Y.; Dupre, K.; McIlwaine, C. The impacts of world cultural heritage site designation and heritage tourism on community livelihoods: A Chinese case study. Tour. Manag. Perspect. 2022 , 43 , 100994. [ Google Scholar ] [ CrossRef ]
- Murphy, P.E.; Murphy, A.E. Strategic Management for Tourism Communities: Bridging the Gaps ; Channel View Publications: Buffalo, UK, 2004. [ Google Scholar ]
- Collins, R. Interaction Ritual Chains ; Princeton University Press: Princeton, NJ, USA, 2004. [ Google Scholar ]
- Leiper, N. The framework of tourism: Towards a definition of tourism, tourist, and the tourist industry. Ann. Tourism Res. 1979 , 6 , 390–407. [ Google Scholar ] [ CrossRef ]
- Qian, X.S.; Yu, J.Y.; Dai, R.W. A new field of science—Open to a complex giant system and its methodology. Chin. J. Nat. 1990 , 1 , 3–10. [ Google Scholar ]
- Sanz-Ibáñez, C.; Anton Clavé, S. The evolution of destinations: Towards an evolutionary and relational economic geography approach. Tour. Geogr. 2014 , 16 , 563–579. [ Google Scholar ] [ CrossRef ]
- Ahmdajina, V. Symbiosis: An Introduction to Biological Associations ; University Press of New England: Hanover, NH, USA, 1986. [ Google Scholar ]
- Li, S.Q. Symbiosis Construction Theory Outline ; China Social Science Press: Xi’an, China, 2004. [ Google Scholar ]
- Yuan, C.Q. Symbiosis Theory: With Concurrent Discussion on Small-Scale Economy ; Economic Science Press: Beijing, China, 1998. [ Google Scholar ]
- Hu, S.J. Social Symbiosis. Hubei Soc. Sci. 2000 , 3 , 11–12. [ Google Scholar ]
- Sørensen, E.; Torfing, J. Enhancing collaborative innovation in the public sector. Admin Soc. 2011 , 43 , 842–868. [ Google Scholar ] [ CrossRef ]
- Douglas, A.E. The symbiotic habit ; Princeton University Press: Princeton, NJ, USA, 2021. [ Google Scholar ]
- Hu, H.; Zhuang, T.H. On the integration development of rural industry from the perspective of symbiosis theory: Symbiosis mechanism, practical dilemma and promotion strategy. Issues Agr. Econ. 2020 , 8 , 68–76. [ Google Scholar ]
- Stringer, P.F.; Pearce, P.L. Toward a symbiosis of social psychology and tourism studies. Ann. Tourism Res. 1984 , 11 , 5–17. [ Google Scholar ] [ CrossRef ]
- Liu, W.; Wang, T.; Tan, X.J. Research on the scenic area-based rural tourism planning from the perspective of regional coordinated development: Taking Wuxi County of Chongqing as an example. Dev. Small Cities Towns 2021 , 3 , 32–40. [ Google Scholar ]
- Cheng, M.Y.; Liu, Y.; Jiang, N. Study on the spatial pattern and mechanism of rural population-land-industry coordinating development in Huang-Huai-Hai Area. Acta Geogr. Sin. 2019 , 74 , 1576–1589. [ Google Scholar ]
- Iguman, S. Re-interpretation of natural and cultural heritage symbiosis as a tool for sustainable tourism development in Belgrade. In Proceedings of the 2015 Sitcon-Singidunum International Tourism Conference, Singidunum University, Belgrade, Serbia, 25 September 2015. [ Google Scholar ]
- Yang, D. A study on the symbiosis between tourism scenic spot and local community development: A case study of Shawan Ancient Town. Int. Bus. Manag. 2016 , 13 , 22–26. [ Google Scholar ]
- Ajagunna, I.; Pinnock, F.; Amode, T.M. Tourism development and logistics in the Caribbean: Will there be a symbiotic relationship? Worldw. Hosp. Tour. Themes 2017 , 9 , 116–123. [ Google Scholar ] [ CrossRef ]
- Lu, X.L.; Sun, Z.W.; Ma, S.M. The symbiotic relationship and the polycentric cooperative development countermeasures of urban tourism in Beijing-Tianjin-Hebei metropolitan. Econ. Geogr. 2016 , 36 , 181–187. [ Google Scholar ]
- Xu, C.X.; She, B.L. Market dynamic mechanisms in the symbiosis between tourist destinations. Tour. Trib. 2016 , 31 , 96–105. [ Google Scholar ]
- Lian, Y.Q. A review of foreign literature of innovation network and regional symbiotic innovation strategy. Hum. Geogr. 2016 , 31 , 26–32. [ Google Scholar ]
- Su, J.; Sun, J.X. Microcosmic research on the impact of tourism on social relations changes in ethnic communities: Taking Basha Miao village as an example. Tour. Trib. 2017 , 32 , 87–95. [ Google Scholar ]
- Weng, X.; Lv, X.; Li, X. Study on the implementation mechanism of symbiosis theory used in economic field. Econ. 2016 , 5 , 56–63. [ Google Scholar ] [ CrossRef ]
- Berno, T. When is a guest a guest? Cook Islanders conceptualize tourism. Ann. Tourism Res. 1999 , 26 , 565–675. [ Google Scholar ] [ CrossRef ]
- Dann, G.; Cohen, E. Sociology and tourism. Ann. Tourism Res. 1991 , 18 , 155–169. [ Google Scholar ] [ CrossRef ]
- Cohen, E. Authenticity and commoditization in tourism. Ann. Tourism Res. 1988 , 15 , 371–386. [ Google Scholar ] [ CrossRef ]
- Van den Berghe, P.L.; Keyes, C.F. Introduction tourism and re-created ethnicity. Ann. Tourism Res. 1984 , 3 , 343–352. [ Google Scholar ]
- Maoz, D. The mutual gaze. Ann. Tourism Res. 2006 , 33 , 221–239. [ Google Scholar ] [ CrossRef ]
- Urry, J. The Tourist Gaze , 2nd ed.; Sage Publications: New York, NY, USA, 2002. [ Google Scholar ]
- Hu, H.X. Gazing or dialogue: Rethinking about the theory of tourists’ gaze. Tour. Trib. 2010 , 25 , 72–76. [ Google Scholar ]
- Feng, J.C. The dilemma and the way out of the traditional villages—Traditional villages are another kind of cultural heritage. Forum Folk Cult. 2013 , 1 , 7–12. [ Google Scholar ]
- Coghlan, A.; Weiler, B. Examining transformative processes in volunteer tourism. Curr. Issues Tour. 2018 , 21 , 567–582. [ Google Scholar ] [ CrossRef ]
- Graburn, N.H.H. Tourism: The Sacred Journey ; University of Pennsylvania Press: Philadelphia, PA, USA, 1977. [ Google Scholar ]
- Kim, S.M. International Tourism in Korea: Barriers and Challenges. Int. J. Tour. Sci. 2003 , 3 , 151–162. [ Google Scholar ] [ CrossRef ]
- Woosnam, K.M. Using emotional solidarity to explain residents’ attitudes about tourism and tourism development. J. Travel. Res. 2012 , 51 , 315–327. [ Google Scholar ] [ CrossRef ]
- Woosnam, K.M.; Norman, W.C.; Ying, T.Y. Exploring the theoretical framework of emotional solidarity between residents and tourists. J. Travel. Res. 2009 , 48 , 245–258. [ Google Scholar ] [ CrossRef ]
- Kim, D.J.; Zhang, D. The effects of sense of presence, sense of belonging, and cognitive absorption on satisfaction and user loyalty toward an immersive 3D virtual world. In Proceedings of the 8th Workshop on E-Business, Berlin, Germany, 15 December 2009; pp. 30–43. [ Google Scholar ]
- Du, Z.B.; Su, Q. Study on the relationship between the community participation of rural tourism, residents’ perceived tourism impact and sense of community involvement—A case study of Anji rural tourism destination, Zhejiang Province. Tour. Trib. 2011 , 26 , 65–70. [ Google Scholar ]
- Liu, Q. Study on relationship of customer value and customer sense of belong. J. Jinan Univ. 2008 , 30 , 65–71. [ Google Scholar ]
- Coordinated Development of the Beijing-Tianjin-Hebei Region. Available online: https://www.ndrc.gov.cn/gjzl/jjjxtfz/201911/t20191127_1213171.html (accessed on 24 July 2024).
- The Development and Reform Commission Issued a Notice on the Development Plan of the Central Plains Urban Agglomeration. Available online: https://www.gov.cn/xinwen/2017-01/05/content_5156816.htm (accessed on 24 July 2024).
- Handan 2023 Statistical Snapshot. Available online: https://www.hd.gov.cn/hdzfxxgk/gszbm/auto23694/202402/t20240202_2019955.html (accessed on 24 July 2024).
- The Only One in the Province! Guangfu Ancient City on the List. Available online: https://www.hdyn.gov.cn/doc/2024/02/20/114406.shtml (accessed on 7 August 2024).
- Creswell, J.W.; Creswell, J.D. Research Design: Qualitative, Quantitative, and Mixed Methods Approaches ; Sage publications: New York, NY, USA, 2017. [ Google Scholar ]
- Khoo-Lattimore, C.; Mura, P.; Yung, R. The time has come: A systematic literature review of mixed methods research in tourism. Curr. Issues Tour. 2019 , 22 , 1531–1550. [ Google Scholar ] [ CrossRef ]
- Eisenhardt, K.M. Building theories from case study research. Acad. Manag. Rev. 1989 , 14 , 50–53. [ Google Scholar ] [ CrossRef ]
- King, N.; Horrocks, C. Interviews in Qualitative Research ; Sage Publications: London, UK, 2010. [ Google Scholar ]
- Cui, L. A co citation cluster analysis to highly cited in special documentation. Inf. Stud. Theory A 1996 , 1 , 46–48. [ Google Scholar ]
- Hair, J.F.; Black, W.C.; Babin, B.J.; Anderson, R.E. Multivariate Data Analysis , 7th ed.; Prentice Hall: Englewood Cliffs, NJ, USA, 2009. [ Google Scholar ]
- Joo, D.; Tasci, A.D.; Woosnam, K.M.; Maruyama, N.U.; Hollas, C.R.; Aleshinloye, K.D. Residents’ attitude towards domestic tourists explained by contact, emotional solidarity and social distance. Tourism Manag. 2018 , 64 , 245–257. [ Google Scholar ] [ CrossRef ]
- Gursoy, D.; Rutherford, D.G. Host attitudes toward tourism: An improved structural model. Ann Tourism Res. 2004 , 31 , 495–516. [ Google Scholar ] [ CrossRef ]
- McCool, S.F.; Martin, S.R. Community attachment and attitudes toward tourism development. J Travel Res. 1994 , 32 , 29–34. [ Google Scholar ] [ CrossRef ]
- Lv, W.Q. A study on residents’ participation behavior in sustainable heritage tourism: From the perspective of planned behavior theory. Soc Sci. 2019 , 12 , 89–100. [ Google Scholar ]
- Qin, H. Knowledge discovery through co-word analysis. Libr. Trends 1999 , 48 , 133–159. [ Google Scholar ]
- Garson, D. Testing Statistical Assumptions ; Statistical Publishing Associates: Hillsborough, NC, USA, 2012. [ Google Scholar ]
- Li, D.; Wang, Y.Q.; Chen, Y.T.; Huang, D.; Dai, C.X. Research on subjective well-being detection and pro-tourism behavior of residents in community embedded destination: The conditional effect of positive and negative perception. Areal Res. Dev. 2020 , 39 , 109–114. [ Google Scholar ]
- Serene, T.; Vincent, W. Residents’ discrimination against tourists. Ann. Tourism Res. 2021 , 88 , 1–4. [ Google Scholar ]
| No. | Gender | Identity | Date of Interview | Location of Interview | Duration |
|---|---|---|---|---|---|
| V01 | Male | Ticket checking staff | 9 June 2022 | The entrance | 32 min |
| V02 | Female | Snack bar owner | 11 June 2022 | Canton Street East | 18 min |
| V03 | Male | Clothing shop owner | 11 June 2022 | Canton Street East | 40 min |
| V04 | Female | Milk tea shop owner | 11 June 2022 | Canton Street East | 25 min |
| V05 | Male | Returning villagers | 12 June 2022 | Inside the Ancient City | 47 min |
| T01 | Female | Tourist (from Handan) | 9 June 2022 | East Gate | 9 min |
| T02 | Male and female | A couple (from Handan) | 11 June 2022 | East Gate | 24 min |
| T03 | Male and female | Family (from Henan) | 12 June 2022 | East Gate | 35 min |
| T04 | Male | Tourists (aged 60+) | 12 June 2022 | South Gate | 7 min |
| T05 | Female | Tourist (from Handan) | 13 June 2022 | South Gate | 16 min |
| Items | Frequency | Percentage (%) | Items | Frequency | Percentage (%) |
|---|---|---|---|---|---|
| Male | 180 | 58.3% | Tourism practitioners | 241 | 78% |
| Female | 129 | 41.7% | Students | 21 | 6.8% |
| Government/Enterprise Workers | 19 | 6.2% | |||
| Under 18 | 9 | 2.9% | Professionals | 14 | 4.5% |
| 18–29 | 62 | 20.1% | Technicians | 8 | 2.6% |
| 30–39 | 164 | 53.1% | Others | 6 | 1.9% |
| 40–49 | 57 | 18.4% | | ||
| 50–59 | 10 | 3.2% | Less than 3000 RMB | 69 | 22.3% |
| Over 60 | 7 | 2.3% | 3000–5000 RMB | 74 | 24% |
| 5001–7000 RMB | 48 | 15.5% | |||
| Primary and below | 20 | 6.5% | 7001–8000 RMB | 45 | 14.6% |
| Junior high school | 160 | 51.8% | 8001–10,000 RMB | 40 | 12.9% |
| High School | 70 | 22.6% | 10,001 RMB and above | 33 | 10.7% |
| Undergraduate and above | 59 | 19.1% |
| Variables | Mean | S.D. | Skewness | Kurtosis | Estimate | AVE | C.R. | Cronbach’s Alpha |
|---|---|---|---|---|---|---|---|---|
| 0.635 | 0.874 | 0.874 | ||||||
| I am proud to have visitors come to Guangfu. (WN 1) | 3.58 | 1.311 | −0.647 | −0.706 | 0.856 | |||
| I feel the community benefits from having visitors in Guangfu.(WN2) | 3.66 | 1.35 | −0.749 | −0.643 | 0.757 | |||
| I appreciate visitors for the contribution they make to the local economy. (WN3) | 3.74 | 1.364 | −0.758 | −0.675 | 0.805 | |||
| I treat visitors fairly in Guangfu. (WN4) | 3.76 | 1.283 | −0.764 | −0.553 | 0.765 | |||
| 0.696 | 0.872 | 0.871 | ||||||
| I feel close to some visitors I have met in Guangfu. (EC1) | 3.75 | 1.26 | −0.81 | −0.358 | 0.763 | |||
| I have made friends with some visitors in Guangfu. (EC2) | 3.69 | 1.315 | −0.707 | −0.691 | 0.88 | |||
| I enjoy the process of interacting with tourists.(EC3) | 3.69 | 1.285 | −0.672 | −0.699 | 0.855 | |||
| 0.604 | 0.859 | 0.858 | ||||||
| I identify with visitors in Guangfu. (SU1) | 3.66 | 1.077 | −0.727 | 0.104 | 0.758 | |||
| I have a lot in common with Guangfu’s visitors.(SU2) | 3.74 | 0.992 | −0.846 | 0.489 | 0.776 | |||
| I feel affection towards visitors in Guangfu. (SU3) | 3.79 | 1.025 | −0.699 | 0.098 | 0.737 | |||
| I understand visitors in Guangfu. (SU4) | 3.74 | 1.049 | −0.782 | 0.129 | 0.834 | |||
| 0.611 | 0.862 | 0.864 | ||||||
| I like Guangfu. (CB1) | 3.8 | 1.259 | −0.701 | −0.729 | 0.857 | |||
| I am very concerned about the construction of Guangfu. (CB2) | 3.85 | 1.216 | −0.891 | −0.28 | 0.765 | |||
| I do not want to move away from Guangfu. (CB3) | 3.69 | 1.262 | −0.716 | −0.506 | 0.719 | |||
| I am on good terms with the other members in Guangfu. (CB4) | 3.69 | 1.262 | −0.638 | −0.71 | 0.78 | |||
| 0.642 | 0.877 | 0.876 | ||||||
| I am willing to participate in resource conservation and environmental monitoring in Guangfu. (WPT1) | 3.53 | 1.234 | −0.377 | −0.886 | 0.824 | |||
| I am willing to provide high quality services to the tourists in Guangfu. (WPT2) | 3.57 | 1.296 | −0.571 | −0.813 | 0.74 | |||
| I am willing to be involved in improving the quality of life of community residents in Guangfu. (WPT3) | 3.67 | 1.243 | −0.533 | −0.875 | 0.835 | |||
| I am willing to participate in the transmission and preservation of national culture in Guangfu.(WPT4) | 3.6 | 1.176 | −0.451 | −0.863 | 0.802 | |||
| Welcoming Nature | Emotional Closeness | Sympathetic Understanding | A sense of Community Belonging | Willingness to Participate in Tourism | |
|---|---|---|---|---|---|
| Welcoming nature | 0.797 * | ||||
| Emotional closeness | 0.486 | 0.834 * | |||
| Sympathetic understanding | 0.329 | 0.345 | 0.777 * | ||
| A sense of community belonging | 0.590 | 0.579 | 0.407 | 0.781 * | |
| Willingness to participate in tourism | 0.372 | 0.398 | 0.325 | 0.436 | 0.801 * |
| Hypothesis Paths | Estimate | Hypothesis |
|---|---|---|
| H1a: Welcoming nature → A sense of community belonging | 0.59 *** | H1a: supported |
| H1b: Emotional closeness → A sense of community belonging | 0.579 * | H1b: supported |
| H1c: Sympathetic understanding → A sense of community belonging | 0.407 * | H1c: supported |
| H2a: A sense of community belonging → Willingness to participate in tourism | 0.436 *** | H2a: supported |
| The statements, opinions and data contained in all publications are solely those of the individual author(s) and contributor(s) and not of MDPI and/or the editor(s). MDPI and/or the editor(s) disclaim responsibility for any injury to people or property resulting from any ideas, methods, instructions or products referred to in the content. |
Share and Cite
Tao, H.; Chen, X.; Sun, Y.; Wang, Z. Towards the Wall or the Bridge? A Case Study of Host–Guest Symbiosis in a Chinese Heritage Tourism Site. Land 2024 , 13 , 1315. https://doi.org/10.3390/land13081315
Tao H, Chen X, Sun Y, Wang Z. Towards the Wall or the Bridge? A Case Study of Host–Guest Symbiosis in a Chinese Heritage Tourism Site. Land . 2024; 13(8):1315. https://doi.org/10.3390/land13081315
Tao, Hui, Xiaoying Chen, Yehong Sun, and Zhe Wang. 2024. "Towards the Wall or the Bridge? A Case Study of Host–Guest Symbiosis in a Chinese Heritage Tourism Site" Land 13, no. 8: 1315. https://doi.org/10.3390/land13081315
Article Metrics
Article access statistics, further information, mdpi initiatives, follow mdpi.
Subscribe to receive issue release notifications and newsletters from MDPI journals

An official website of the United States government
Here's how you know
Official websites use .gov A .gov website belongs to an official government organization in the United States.
Secure .gov websites use HTTPS A lock ( ) or https:// means you’ve safely connected to the .gov website. Share sensitive information only on official, secure websites.
- Digg
Latest Earthquakes | Chat Share Social Media
Code for quantitative support for the benefits of proactive management for wildlife disease control
This software release contains the input data, R scripts, and Rmarkdown visualization scripts. This includes (i) aggregation code of expert elicited parameter estimates, (ii) simulation code using our develop dynamic multi-state occupancy model for no management, proactive management, and reactive management, (iii) code for probabilistic decision trees, and (iv) Rmarkdown scripts visualize the simulation and decision tree results
Citation Information
| Publication Year | 2024 |
|---|---|
| Title | Code for quantitative support for the benefits of proactive management for wildlife disease control |
| DOI | |
| Authors | Graziella V Direnzo, Evan H Grant, Molly Bletz |
| Product Type | Software Release |
| Record Source | |
| USGS Organization | Cooperative Research Units Program |
Related Content
Grace v. direnzo, phd, research wildlife biologist, evan grant, ph.d..
IMAGES
COMMENTS
The purpose of case study research is twofold: (1) to provide descriptive information and (2) to suggest theoretical relevance. Rich description enables an in-depth or sharpened understanding of the case. It is unique given one characteristic: case studies draw from more than one data source. Case studies are inherently multimodal or mixed ...
Although case studies have been discussed extensively in the literature, little has been written about the specific steps one may use to conduct case study research effectively (Gagnon, 2010; Hancock & Algozzine, 2016).Baskarada (2014) also emphasized the need to have a succinct guideline that can be practically followed as it is actually tough to execute a case study well in practice.
The basic. case survey is (1) select a group of existing case studies. chosen research questions, (2) design a coding scheme for. version of the qualitative case descriptions into quantified variables, (3) use multiple raters to code the cases and measure their interrater reliability, and.
A Case study is: An in-depth research design that primarily uses a qualitative methodology but sometimes includes quantitative methodology. Used to examine an identifiable problem confirmed through research. Used to investigate an individual, group of people, organization, or event. Used to mostly answer "how" and "why" questions.
A case study involves an in-depth analysis of a specific individual, group, or situation, aiming to understand the complexities and unique aspects of the subject. It often involves collecting qualitative data through interviews, observations, and document analysis. On the other hand, a survey is a structured data collection method that involves ...
Revised on November 20, 2023. A case study is a detailed study of a specific subject, such as a person, group, place, event, organization, or phenomenon. Case studies are commonly used in social, educational, clinical, and business research. A case study research design usually involves qualitative methods, but quantitative methods are ...
A case study is a research method that involves an in-depth examination and analysis of a particular phenomenon or case, such as an individual, organization, community, event, or situation. It is a qualitative research approach that aims to provide a detailed and comprehensive understanding of the case being studied.
Case surveys bridge the gap between nomothetic surveys and idiographic case studies to combine their respective benefits of generalizable, crosssectional analysis and in-depth, processual analysis. Methodological fragmentation has limited systematic utilization of numerous managerially relevant case studies. This article develops a comprehensive procedure synthesizing the individual strengths ...
What is a case study? Whereas quantitative methods look at phenomena at scale, case study research looks at a concept or phenomenon in considerable detail. While analyzing a single case can help understand one perspective regarding the object of research inquiry, analyzing multiple cases can help obtain a more holistic sense of the topic or issue.
Case study research has a long history within the natural sciences, social sciences, and humanities, dating back to the early 1920's. At first it was a useful way for researchers to make valid inferences from events outside the laboratory in ways consistent with the rigorous practices of investigation inside the lab.
A case study, also known as a case report, is an in depth or intensive study of a single individual or specific group, while a case series is a grouping of similar case studies / case reports together. A case study / case report can be used in the following instances: where there is atypical or abnormal behaviour or development.
A case study is one of the most commonly used methodologies of social research. This article attempts to look into the various dimensions of a case study research strategy, the different epistemological strands which determine the particular case study type and approach adopted in the field, discusses the factors which can enhance the effectiveness of a case study research, and the debate ...
Many data collection methods can be either qualitative or quantitative. For example, in surveys, observational studies or case studies, your data can be represented as numbers (e.g., using rating scales or counting frequencies) or as words (e.g., with open-ended questions or descriptions of what you observe).
Survey research means collecting information about a group of people by asking them questions and analyzing the results. To conduct an effective survey, follow these six steps: Determine who will participate in the survey. Decide the type of survey (mail, online, or in-person) Design the survey questions and layout.
Survey research is defined as "the collection of information from a sample of individuals through their responses to questions" ( Check & Schutt, 2012, p. 160 ). This type of research allows for a variety of methods to recruit participants, collect data, and utilize various methods of instrumentation. Survey research can use quantitative ...
INTRODUCTION. Scientific research is usually initiated by posing evidenced-based research questions which are then explicitly restated as hypotheses.1,2 The hypotheses provide directions to guide the study, solutions, explanations, and expected results.3,4 Both research questions and hypotheses are essentially formulated based on conventional theories and real-world processes, which allow the ...
Case surveys bridge the gap between nomothetic surveys and idiographic case studies to combine their respective benefits of generalizable, cross-sectional analysis and in-depth, processual analysis. ... Case survey methodology: Quantitative analysis of patterns across case studies. Academy of Management Journal, 36(6), 1515-1546. https ...
The case for combining research methods generally, and more specifically that for combining qualitative and quantitative methods, is strong. Yet, research designs that extensively integrate both fieldwork (e.g. case studies) and survey research are rare. Moreover, some journals tend tacitly to specialise by methodology thereby encouraging purity of method. The multi-method model of research ...
Survey Research. Definition: Survey Research is a quantitative research method that involves collecting standardized data from a sample of individuals or groups through the use of structured questionnaires or interviews. The data collected is then analyzed statistically to identify patterns and relationships between variables, and to draw conclusions about the population being studied.
Despite the frequent calls for a combined use of QCA in mixed-method research designs, our analysis shows that only 34% of studies used QCA as complementary to other qualitative (e.g., case ...
A case study involves a detailed examination of a single subject, such as an individual, event, or organization, to gain in-depth insights. In contrast, a survey is a research tool used to gather data from a sample population, focusing on gathering quantitative information or opinions through questions. 14. Case studies are often used in fields ...
Usefulness for research: Methodological articles are useful because they provide a methodologies you can apply to your own research. Case Studies. Distinguishing characteristic: Case studies focus on individual examples or instances of a phenomenon to illustrate a research problem or a a solution to a research problem.
According to Gurbuz (2017), a survey in the form of a quantitative method is commonly used to collect data by researchers due to the time constraint, low budget, mass target, and simple ...
The survey probed perceptions of many aspects of the ward environment before and after the move. As discussed in Chapter 3, the trust, the designers and stakeholders held various expectations about the benefits of the 100% single room design. We examined whether or not these expectations (or hypotheses about the effect of the move) were fulfilled. Specifically, the new hospital was designed to ...
Include a mix of open-ended and closed-ended questions to capture both quantitative and qualitative data. Open-ended questions provide rich, detailed feedback, while closed-ended questions are easier to analyze statistically. ... Case Studies of Top-Notch Survey Programs. Fostering Growth Mindset at a 2023 Blue Ribbon School: How Maunawili ...
In a separate question, 47% say that "people saying things that are very offensive to others" is a major problem, according to a Pew Research Center survey conducted in April. How we did this Pew Research Center conducted this analysis to understand Americans' views on whether offensive speech - and people being too easily offended by ...
The numbers don't lie: The International Coaching Federation (ICF), in partnership with PwC, estimated global coaching revenue in 2019 to be $2.849 billion—a 21% increase from 2015—and a ...
Aim: To gain a deeper understanding of what is important to nurses when thinking about shift patterns and the organisation of working time. Design: A cross‐sectional survey of nursing staff working across the UK and Ireland collected quantitative and qualitative responses. Methods: We recruited from two National Health Service Trusts and through an open call via trade union membership ...
The close connection between community residents and tourists in heritage tourism sites strengthens the relationship between people and places. To explore the mechanisms of host-guest interaction and the driving factors of residents' willingness to participate in tourism in heritage tourism destinations, this study adopts a mixed-method approach combining qualitative research and ...
This software release contains the input data, R scripts, and Rmarkdown visualization scripts. This includes (i) aggregation code of expert elicited parameter estimates, (ii) simulation code using our develop dynamic multi-state occupancy model for no management, proactive management, and reactive management, (iii) code for probabilistic decision trees, and (iv) Rmarkdown scripts visualize the sim