Educational resources and simple solutions for your research journey


How to Write the Methods Section of a Research Paper
Writing a research paper is both an art and a skill, and knowing how to write the methods section of a research paper is the first crucial step in mastering scientific writing. If, like the majority of early career researchers, you believe that the methods section is the simplest to write and needs little in the way of careful consideration or thought, this article will help you understand it is not 1 .
We have all probably asked our supervisors, coworkers, or search engines “ how to write a methods section of a research paper ” at some point in our scientific careers, so you are not alone if that’s how you ended up here. Even for seasoned researchers, selecting what to include in the methods section from a wealth of experimental information can occasionally be a source of distress and perplexity.
Additionally, journal specifications, in some cases, may make it more of a requirement rather than a choice to provide a selective yet descriptive account of the experimental procedure. Hence, knowing these nuances of how to write the methods section of a research paper is critical to its success. The methods section of the research paper is not supposed to be a detailed heavy, dull section that some researchers tend to write; rather, it should be the central component of the study that justifies the validity and reliability of the research.
Are you still unsure of how the methods section of a research paper forms the basis of every investigation? Consider the last article you read but ignore the methods section and concentrate on the other parts of the paper . Now think whether you could repeat the study and be sure of the credibility of the findings despite knowing the literature review and even having the data in front of you. You have the answer!

Having established the importance of the methods section , the next question is how to write the methods section of a research paper that unifies the overall study. The purpose of the methods section , which was earlier called as Materials and Methods , is to describe how the authors went about answering the “research question” at hand. Here, the objective is to tell a coherent story that gives a detailed account of how the study was conducted, the rationale behind specific experimental procedures, the experimental setup, objects (variables) involved, the research protocol employed, tools utilized to measure, calculations and measurements, and the analysis of the collected data 2 .
In this article, we will take a deep dive into this topic and provide a detailed overview of how to write the methods section of a research paper . For the sake of clarity, we have separated the subject into various sections with corresponding subheadings.
Table of Contents
What is the methods section of a research paper ?
The methods section is a fundamental section of any paper since it typically discusses the ‘ what ’, ‘ how ’, ‘ which ’, and ‘ why ’ of the study, which is necessary to arrive at the final conclusions. In a research article, the introduction, which serves to set the foundation for comprehending the background and results is usually followed by the methods section, which precedes the result and discussion sections. The methods section must explicitly state what was done, how it was done, which equipment, tools and techniques were utilized, how were the measurements/calculations taken, and why specific research protocols, software, and analytical methods were employed.
Why is the methods section important?
The primary goal of the methods section is to provide pertinent details about the experimental approach so that the reader may put the results in perspective and, if necessary, replicate the findings 3 . This section offers readers the chance to evaluate the reliability and validity of any study. In short, it also serves as the study’s blueprint, assisting researchers who might be unsure about any other portion in establishing the study’s context and validity. The methods plays a rather crucial role in determining the fate of the article; an incomplete and unreliable methods section can frequently result in early rejections and may lead to numerous rounds of modifications during the publication process. This means that the reviewers also often use methods section to assess the reliability and validity of the research protocol and the data analysis employed to address the research topic. In other words, the purpose of the methods section is to demonstrate the research acumen and subject-matter expertise of the author(s) in their field.
Structure of methods section of a research paper
Similar to the research paper, the methods section also follows a defined structure; this may be dictated by the guidelines of a specific journal or can be presented in a chronological or thematic manner based on the study type. When writing the methods section , authors should keep in mind that they are telling a story about how the research was conducted. They should only report relevant information to avoid confusing the reader and include details that would aid in connecting various aspects of the entire research activity together. It is generally advisable to present experiments in the order in which they were conducted. This facilitates the logical flow of the research and allows readers to follow the progression of the study design.

It is also essential to clearly state the rationale behind each experiment and how the findings of earlier experiments informed the design or interpretation of later experiments. This allows the readers to understand the overall purpose of the study design and the significance of each experiment within that context. However, depending on the particular research question and method, it may make sense to present information in a different order; therefore, authors must select the best structure and strategy for their individual studies.
In cases where there is a lot of information, divide the sections into subheadings to cover the pertinent details. If the journal guidelines pose restrictions on the word limit , additional important information can be supplied in the supplementary files. A simple rule of thumb for sectioning the method section is to begin by explaining the methodological approach ( what was done ), describing the data collection methods ( how it was done ), providing the analysis method ( how the data was analyzed ), and explaining the rationale for choosing the methodological strategy. This is described in detail in the upcoming sections.
How to write the methods section of a research paper
Contrary to widespread assumption, the methods section of a research paper should be prepared once the study is complete to prevent missing any key parameter. Hence, please make sure that all relevant experiments are done before you start writing a methods section . The next step for authors is to look up any applicable academic style manuals or journal-specific standards to ensure that the methods section is formatted correctly. The methods section of a research paper typically constitutes materials and methods; while writing this section, authors usually arrange the information under each category.
The materials category describes the samples, materials, treatments, and instruments, while experimental design, sample preparation, data collection, and data analysis are a part of the method category. According to the nature of the study, authors should include additional subsections within the methods section, such as ethical considerations like the declaration of Helsinki (for studies involving human subjects), demographic information of the participants, and any other crucial information that can affect the output of the study. Simply put, the methods section has two major components: content and format. Here is an easy checklist for you to consider if you are struggling with how to write the methods section of a research paper .
- Explain the research design, subjects, and sample details
- Include information on inclusion and exclusion criteria
- Mention ethical or any other permission required for the study
- Include information about materials, experimental setup, tools, and software
- Add details of data collection and analysis methods
- Incorporate how research biases were avoided or confounding variables were controlled
- Evaluate and justify the experimental procedure selected to address the research question
- Provide precise and clear details of each experiment
- Flowcharts, infographics, or tables can be used to present complex information
- Use past tense to show that the experiments have been done
- Follow academic style guides (such as APA or MLA ) to structure the content
- Citations should be included as per standard protocols in the field
Now that you know how to write the methods section of a research paper , let’s address another challenge researchers face while writing the methods section —what to include in the methods section . How much information is too much is not always obvious when it comes to trying to include data in the methods section of a paper. In the next section, we examine this issue and explore potential solutions.

What to include in the methods section of a research paper
The technical nature of the methods section occasionally makes it harder to present the information clearly and concisely while staying within the study context. Many young researchers tend to veer off subject significantly, and they frequently commit the sin of becoming bogged down in itty bitty details, making the text harder to read and impairing its overall flow. However, the best way to write the methods section is to start with crucial components of the experiments. If you have trouble deciding which elements are essential, think about leaving out those that would make it more challenging to comprehend the context or replicate the results. The top-down approach helps to ensure all relevant information is incorporated and vital information is not lost in technicalities. Next, remember to add details that are significant to assess the validity and reliability of the study. Here is a simple checklist for you to follow ( bonus tip: you can also make a checklist for your own study to avoid missing any critical information while writing the methods section ).
- Structuring the methods section : Authors should diligently follow journal guidelines and adhere to the specific author instructions provided when writing the methods section . Journals typically have specific guidelines for formatting the methods section ; for example, Frontiers in Plant Sciences advises arranging the materials and methods section by subheading and citing relevant literature. There are several standardized checklists available for different study types in the biomedical field, including CONSORT (Consolidated Standards of Reporting Trials) for randomized clinical trials, PRISMA (Preferred Reporting Items for Systematic reviews and Meta-Analysis) for systematic reviews and meta-analysis, and STROBE (STrengthening the Reporting of OBservational studies in Epidemiology) for cohort, case-control, cross-sectional studies. Before starting the methods section , check the checklist available in your field that can function as a guide.
- Organizing different sections to tell a story : Once you are sure of the format required for structuring the methods section , the next is to present the sections in a logical manner; as mentioned earlier, the sections can be organized according to the chronology or themes. In the chronological arrangement, you should discuss the methods in accordance with how the experiments were carried out. An example of the method section of a research paper of an animal study should first ideally include information about the species, weight, sex, strain, and age. Next, the number of animals, their initial conditions, and their living and housing conditions should also be mentioned. Second, how the groups are assigned and the intervention (drug treatment, stress, or other) given to each group, and finally, the details of tools and techniques used to measure, collect, and analyze the data. Experiments involving animal or human subjects should additionally state an ethics approval statement. It is best to arrange the section using the thematic approach when discussing distinct experiments not following a sequential order.
- Define and explain the objects and procedure: Experimental procedure should clearly be stated in the methods section . Samples, necessary preparations (samples, treatment, and drug), and methods for manipulation need to be included. All variables (control, dependent, independent, and confounding) must be clearly defined, particularly if the confounding variables can affect the outcome of the study.
- Match the order of the methods section with the order of results: Though not mandatory, organizing the manuscript in a logical and coherent manner can improve the readability and clarity of the paper. This can be done by following a consistent structure throughout the manuscript; readers can easily navigate through the different sections and understand the methods and results in relation to each other. Using experiment names as headings for both the methods and results sections can also make it simpler for readers to locate specific information and corroborate it if needed.
- Relevant information must always be included: The methods section should have information on all experiments conducted and their details clearly mentioned. Ask the journal whether there is a way to offer more information in the supplemental files or external repositories if your target journal has strict word limitations. For example, Nature communications encourages authors to deposit their step-by-step protocols in an open-resource depository, Protocol Exchange which allows the protocols to be linked with the manuscript upon publication. Providing access to detailed protocols also helps to increase the transparency and reproducibility of the research.
- It’s all in the details: The methods section should meticulously list all the materials, tools, instruments, and software used for different experiments. Specify the testing equipment on which data was obtained, together with its manufacturer’s information, location, city, and state or any other stimuli used to manipulate the variables. Provide specifics on the research process you employed; if it was a standard protocol, cite previous studies that also used the protocol. Include any protocol modifications that were made, as well as any other factors that were taken into account when planning the study or gathering data. Any new or modified techniques should be explained by the authors. Typically, readers evaluate the reliability and validity of the procedures using the cited literature, and a widely accepted checklist helps to support the credibility of the methodology. Note: Authors should include a statement on sample size estimation (if applicable), which is often missed. It enables the reader to determine how many subjects will be required to detect the expected change in the outcome variables within a given confidence interval.
- Write for the audience: While explaining the details in the methods section , authors should be mindful of their target audience, as some of the rationale or assumptions on which specific procedures are based might not always be obvious to the audience, particularly for a general audience. Therefore, when in doubt, the objective of a procedure should be specified either in relation to the research question or to the entire protocol.
- Data interpretation and analysis : Information on data processing, statistical testing, levels of significance, and analysis tools and software should be added. Mention if the recommendations and expertise of an experienced statistician were followed. Also, evaluate and justify the preferred statistical method used in the study and its significance.
What NOT to include in the methods section of a research paper
To address “ how to write the methods section of a research paper ”, authors should not only pay careful attention to what to include but also what not to include in the methods section of a research paper . Here is a list of do not’s when writing the methods section :
- Do not elaborate on specifics of standard methods/procedures: You should refrain from adding unnecessary details of experiments and practices that are well established and cited previously. Instead, simply cite relevant literature or mention if the manufacturer’s protocol was followed.
- Do not add unnecessary details : Do not include minute details of the experimental procedure and materials/instruments used that are not significant for the outcome of the experiment. For example, there is no need to mention the brand name of the water bath used for incubation.
- Do not discuss the results: The methods section is not to discuss the results or refer to the tables and figures; save it for the results and discussion section. Also, focus on the methods selected to conduct the study and avoid diverting to other methods or commenting on their pros or cons.
- Do not make the section bulky : For extensive methods and protocols, provide the essential details and share the rest of the information in the supplemental files. The writing should be clear yet concise to maintain the flow of the section.
We hope that by this point, you understand how crucial it is to write a thoughtful and precise methods section and the ins and outs of how to write the methods section of a research paper . To restate, the entire purpose of the methods section is to enable others to reproduce the results or verify the research. We sincerely hope that this post has cleared up any confusion and given you a fresh perspective on the methods section .
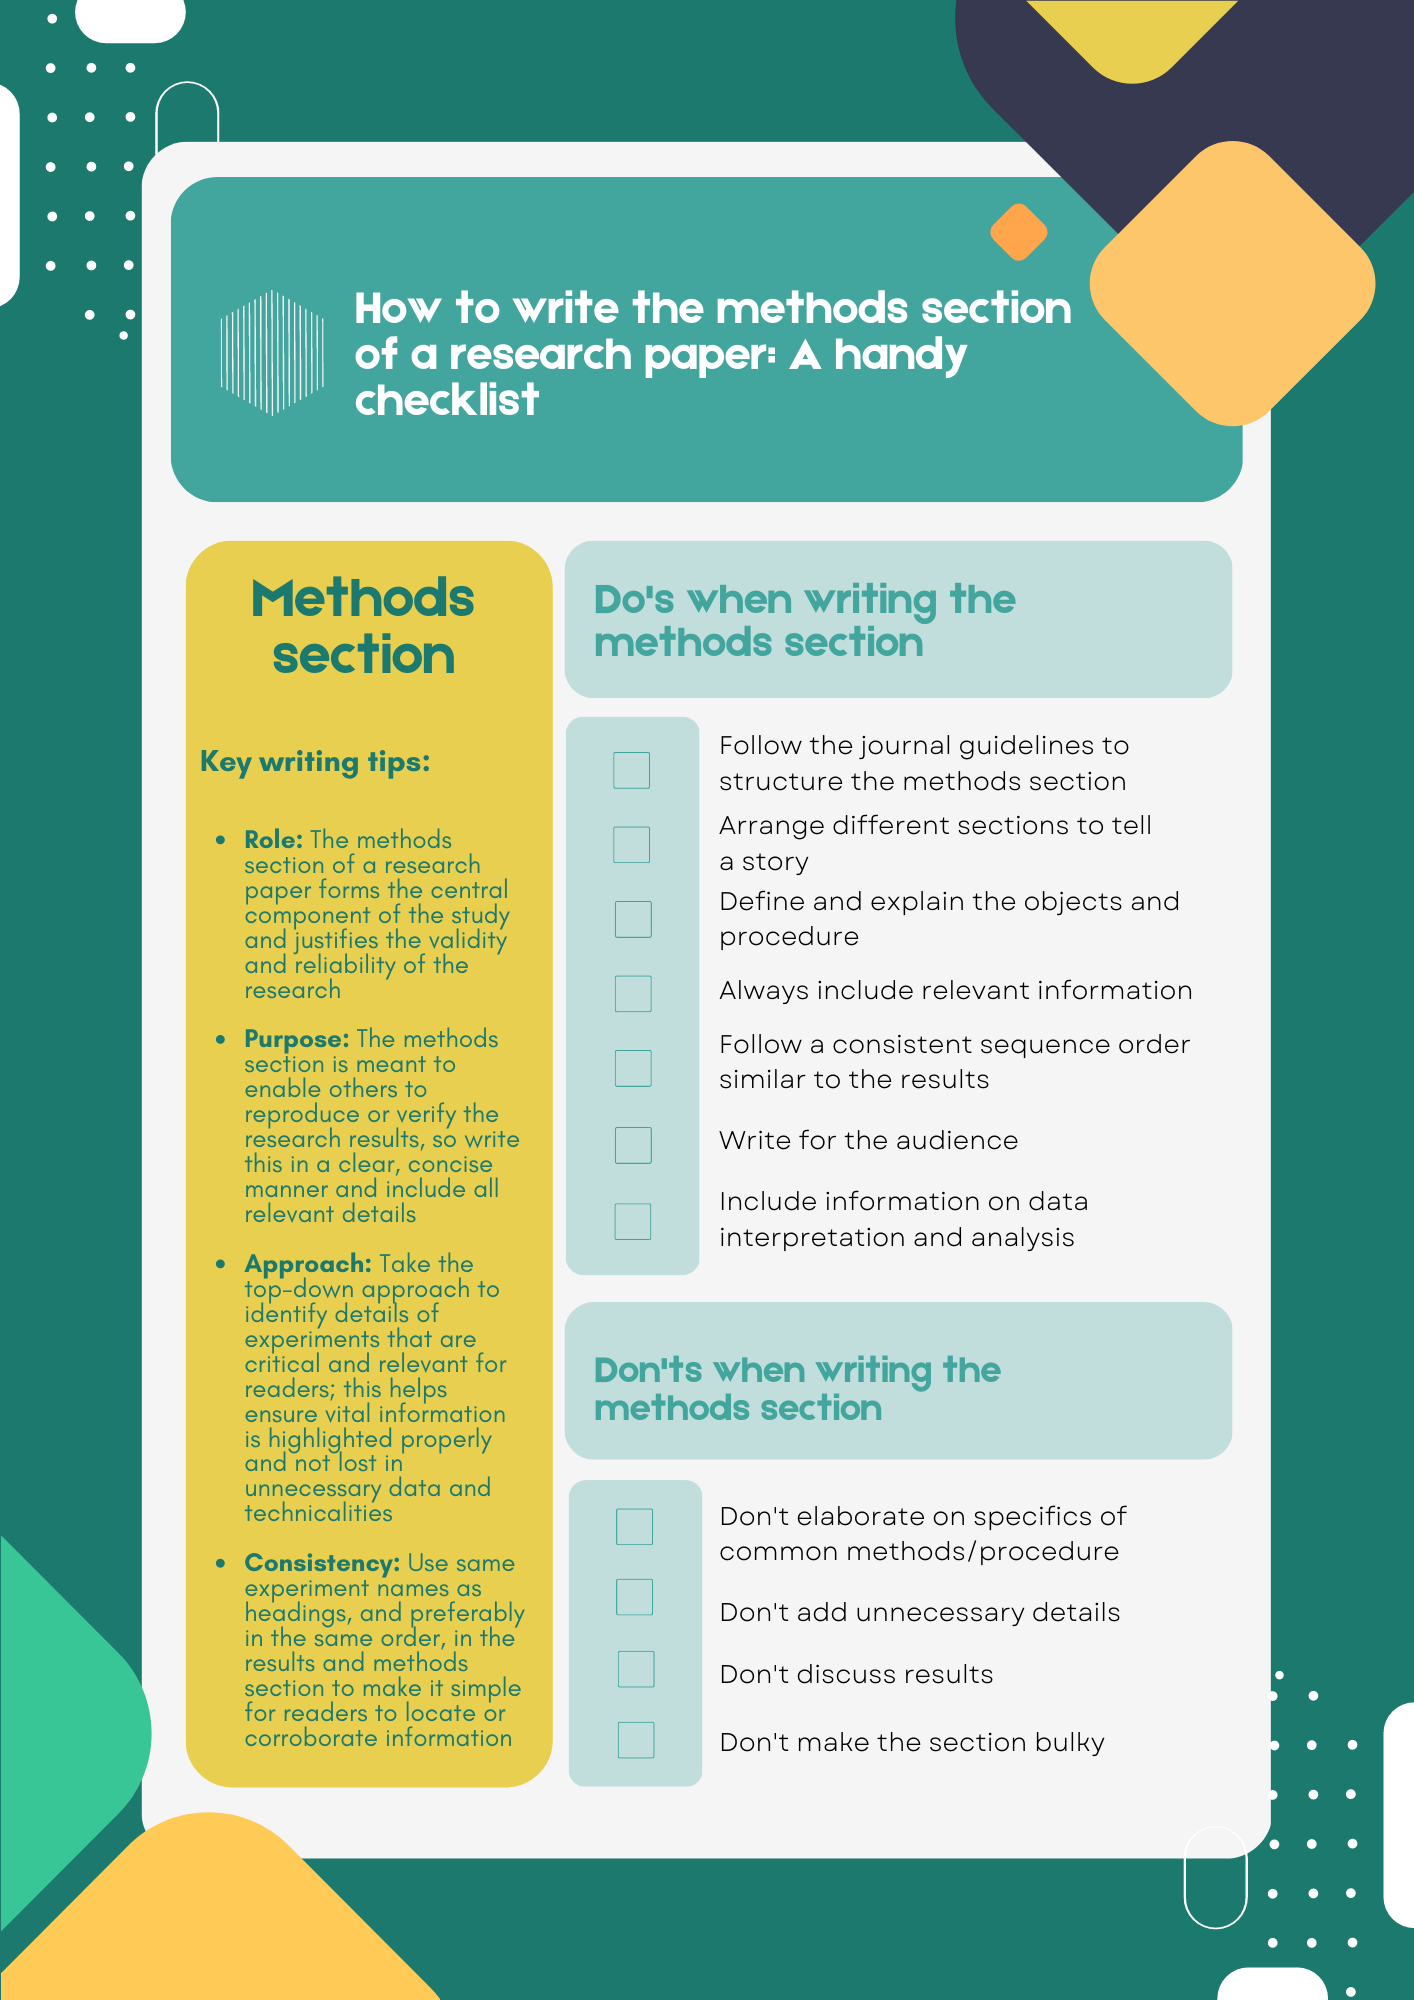
As a parting gift, we’re leaving you with a handy checklist that will help you understand how to write the methods section of a research paper . Feel free to download this checklist and use or share this with those who you think may benefit from it.
References
- Bhattacharya, D. How to write the Methods section of a research paper. Editage Insights, 2018. https://www.editage.com/insights/how-to-write-the-methods-section-of-a-research-paper (2018).
- Kallet, R. H. How to Write the Methods Section of a Research Paper. Respiratory Care 49, 1229–1232 (2004). https://pubmed.ncbi.nlm.nih.gov/15447808/
- Grindstaff, T. L. & Saliba, S. A. AVOIDING MANUSCRIPT MISTAKES. Int J Sports Phys Ther 7, 518–524 (2012). https://www.ncbi.nlm.nih.gov/pmc/articles/PMC3474299/
Editage All Access is a subscription-based platform that unifies the best AI tools and services designed to speed up, simplify, and streamline every step of a researcher’s journey. The Editage All Access Pack is a one-of-a-kind subscription that unlocks full access to an AI writing assistant, literature recommender, journal finder, scientific illustration tool, and exclusive discounts on professional publication services from Editage.
Based on 22+ years of experience in academia, Editage All Access empowers researchers to put their best research forward and move closer to success. Explore our top AI Tools pack, AI Tools + Publication Services pack, or Build Your Own Plan. Find everything a researcher needs to succeed, all in one place – Get All Access now starting at just $14 a month !
Related Posts

Back to School – Lock-in All Access Pack for a Year at the Best Price

Research Paper Appendix: Format and Examples
How To Write The Methodology Chapter
The what, why & how explained simply (with examples).
By: Jenna Crossley (PhD) | Reviewed By: Dr. Eunice Rautenbach | September 2021 (Updated April 2023)
So, you’ve pinned down your research topic and undertaken a review of the literature – now it’s time to write up the methodology section of your dissertation, thesis or research paper . But what exactly is the methodology chapter all about – and how do you go about writing one? In this post, we’ll unpack the topic, step by step .
Overview: The Methodology Chapter
- The purpose of the methodology chapter
- Why you need to craft this chapter (really) well
- How to write and structure the chapter
- Methodology chapter example
- Essential takeaways
What (exactly) is the methodology chapter?
The methodology chapter is where you outline the philosophical underpinnings of your research and outline the specific methodological choices you’ve made. The point of the methodology chapter is to tell the reader exactly how you designed your study and, just as importantly, why you did it this way.
Importantly, this chapter should comprehensively describe and justify all the methodological choices you made in your study. For example, the approach you took to your research (i.e., qualitative, quantitative or mixed), who you collected data from (i.e., your sampling strategy), how you collected your data and, of course, how you analysed it. If that sounds a little intimidating, don’t worry – we’ll explain all these methodological choices in this post .

Why is the methodology chapter important?
The methodology chapter plays two important roles in your dissertation or thesis:
Firstly, it demonstrates your understanding of research theory, which is what earns you marks. A flawed research design or methodology would mean flawed results. So, this chapter is vital as it allows you to show the marker that you know what you’re doing and that your results are credible .
Secondly, the methodology chapter is what helps to make your study replicable. In other words, it allows other researchers to undertake your study using the same methodological approach, and compare their findings to yours. This is very important within academic research, as each study builds on previous studies.
The methodology chapter is also important in that it allows you to identify and discuss any methodological issues or problems you encountered (i.e., research limitations ), and to explain how you mitigated the impacts of these. Every research project has its limitations , so it’s important to acknowledge these openly and highlight your study’s value despite its limitations . Doing so demonstrates your understanding of research design, which will earn you marks. We’ll discuss limitations in a bit more detail later in this post, so stay tuned!
Need a helping hand?
How to write up the methodology chapter
First off, it’s worth noting that the exact structure and contents of the methodology chapter will vary depending on the field of research (e.g., humanities, chemistry or engineering) as well as the university . So, be sure to always check the guidelines provided by your institution for clarity and, if possible, review past dissertations from your university. Here we’re going to discuss a generic structure for a methodology chapter typically found in the sciences.
Before you start writing, it’s always a good idea to draw up a rough outline to guide your writing. Don’t just start writing without knowing what you’ll discuss where. If you do, you’ll likely end up with a disjointed, ill-flowing narrative . You’ll then waste a lot of time rewriting in an attempt to try to stitch all the pieces together. Do yourself a favour and start with the end in mind .
Section 1 – Introduction
As with all chapters in your dissertation or thesis, the methodology chapter should have a brief introduction. In this section, you should remind your readers what the focus of your study is, especially the research aims . As we’ve discussed many times on the blog, your methodology needs to align with your research aims, objectives and research questions. Therefore, it’s useful to frontload this component to remind the reader (and yourself!) what you’re trying to achieve.
In this section, you can also briefly mention how you’ll structure the chapter. This will help orient the reader and provide a bit of a roadmap so that they know what to expect. You don’t need a lot of detail here – just a brief outline will do.

Section 2 – The Methodology
The next section of your chapter is where you’ll present the actual methodology. In this section, you need to detail and justify the key methodological choices you’ve made in a logical, intuitive fashion. Importantly, this is the heart of your methodology chapter, so you need to get specific – don’t hold back on the details here. This is not one of those “less is more” situations.
Let’s take a look at the most common components you’ll likely need to cover.
Methodological Choice #1 – Research Philosophy
Research philosophy refers to the underlying beliefs (i.e., the worldview) regarding how data about a phenomenon should be gathered , analysed and used . The research philosophy will serve as the core of your study and underpin all of the other research design choices, so it’s critically important that you understand which philosophy you’ll adopt and why you made that choice. If you’re not clear on this, take the time to get clarity before you make any further methodological choices.
While several research philosophies exist, two commonly adopted ones are positivism and interpretivism . These two sit roughly on opposite sides of the research philosophy spectrum.
Positivism states that the researcher can observe reality objectively and that there is only one reality, which exists independently of the observer. As a consequence, it is quite commonly the underlying research philosophy in quantitative studies and is oftentimes the assumed philosophy in the physical sciences.
Contrasted with this, interpretivism , which is often the underlying research philosophy in qualitative studies, assumes that the researcher performs a role in observing the world around them and that reality is unique to each observer . In other words, reality is observed subjectively .
These are just two philosophies (there are many more), but they demonstrate significantly different approaches to research and have a significant impact on all the methodological choices. Therefore, it’s vital that you clearly outline and justify your research philosophy at the beginning of your methodology chapter, as it sets the scene for everything that follows.
")
Methodological Choice #2 – Research Type
The next thing you would typically discuss in your methodology section is the research type. The starting point for this is to indicate whether the research you conducted is inductive or deductive .
Inductive research takes a bottom-up approach , where the researcher begins with specific observations or data and then draws general conclusions or theories from those observations. Therefore these studies tend to be exploratory in terms of approach.
Conversely , d eductive research takes a top-down approach , where the researcher starts with a theory or hypothesis and then tests it using specific observations or data. Therefore these studies tend to be confirmatory in approach.
Related to this, you’ll need to indicate whether your study adopts a qualitative, quantitative or mixed approach. As we’ve mentioned, there’s a strong link between this choice and your research philosophy, so make sure that your choices are tightly aligned . When you write this section up, remember to clearly justify your choices, as they form the foundation of your study.
Methodological Choice #3 – Research Strategy
Next, you’ll need to discuss your research strategy (also referred to as a research design ). This methodological choice refers to the broader strategy in terms of how you’ll conduct your research, based on the aims of your study.
Several research strategies exist, including experimental , case studies , ethnography , grounded theory, action research , and phenomenology . Let’s take a look at two of these, experimental and ethnographic, to see how they contrast.
Experimental research makes use of the scientific method , where one group is the control group (in which no variables are manipulated ) and another is the experimental group (in which a specific variable is manipulated). This type of research is undertaken under strict conditions in a controlled, artificial environment (e.g., a laboratory). By having firm control over the environment, experimental research typically allows the researcher to establish causation between variables. Therefore, it can be a good choice if you have research aims that involve identifying causal relationships.
Ethnographic research , on the other hand, involves observing and capturing the experiences and perceptions of participants in their natural environment (for example, at home or in the office). In other words, in an uncontrolled environment. Naturally, this means that this research strategy would be far less suitable if your research aims involve identifying causation, but it would be very valuable if you’re looking to explore and examine a group culture, for example.
As you can see, the right research strategy will depend largely on your research aims and research questions – in other words, what you’re trying to figure out. Therefore, as with every other methodological choice, it’s essential to justify why you chose the research strategy you did.
Methodological Choice #4 – Time Horizon
The next thing you’ll need to detail in your methodology chapter is the time horizon. There are two options here: cross-sectional and longitudinal . In other words, whether the data for your study were all collected at one point in time (cross-sectional) or at multiple points in time (longitudinal).
The choice you make here depends again on your research aims, objectives and research questions. If, for example, you aim to assess how a specific group of people’s perspectives regarding a topic change over time , you’d likely adopt a longitudinal time horizon.
Another important factor to consider is simply whether you have the time necessary to adopt a longitudinal approach (which could involve collecting data over multiple months or even years). Oftentimes, the time pressures of your degree program will force your hand into adopting a cross-sectional time horizon, so keep this in mind.
Methodological Choice #5 – Sampling Strategy
Next, you’ll need to discuss your sampling strategy . There are two main categories of sampling, probability and non-probability sampling.
Probability sampling involves a random (and therefore representative) selection of participants from a population, whereas non-probability sampling entails selecting participants in a non-random (and therefore non-representative) manner. For example, selecting participants based on ease of access (this is called a convenience sample).
The right sampling approach depends largely on what you’re trying to achieve in your study. Specifically, whether you trying to develop findings that are generalisable to a population or not. Practicalities and resource constraints also play a large role here, as it can oftentimes be challenging to gain access to a truly random sample. In the video below, we explore some of the most common sampling strategies.
Methodological Choice #6 – Data Collection Method
Next up, you’ll need to explain how you’ll go about collecting the necessary data for your study. Your data collection method (or methods) will depend on the type of data that you plan to collect – in other words, qualitative or quantitative data.
Typically, quantitative research relies on surveys , data generated by lab equipment, analytics software or existing datasets. Qualitative research, on the other hand, often makes use of collection methods such as interviews , focus groups , participant observations, and ethnography.
So, as you can see, there is a tight link between this section and the design choices you outlined in earlier sections. Strong alignment between these sections, as well as your research aims and questions is therefore very important.
Methodological Choice #7 – Data Analysis Methods/Techniques
The final major methodological choice that you need to address is that of analysis techniques . In other words, how you’ll go about analysing your date once you’ve collected it. Here it’s important to be very specific about your analysis methods and/or techniques – don’t leave any room for interpretation. Also, as with all choices in this chapter, you need to justify each choice you make.
What exactly you discuss here will depend largely on the type of study you’re conducting (i.e., qualitative, quantitative, or mixed methods). For qualitative studies, common analysis methods include content analysis , thematic analysis and discourse analysis . In the video below, we explain each of these in plain language.
For quantitative studies, you’ll almost always make use of descriptive statistics , and in many cases, you’ll also use inferential statistical techniques (e.g., correlation and regression analysis). In the video below, we unpack some of the core concepts involved in descriptive and inferential statistics.
In this section of your methodology chapter, it’s also important to discuss how you prepared your data for analysis, and what software you used (if any). For example, quantitative data will often require some initial preparation such as removing duplicates or incomplete responses . Similarly, qualitative data will often require transcription and perhaps even translation. As always, remember to state both what you did and why you did it.
Section 3 – The Methodological Limitations
With the key methodological choices outlined and justified, the next step is to discuss the limitations of your design. No research methodology is perfect – there will always be trade-offs between the “ideal” methodology and what’s practical and viable, given your constraints. Therefore, this section of your methodology chapter is where you’ll discuss the trade-offs you had to make, and why these were justified given the context.
Methodological limitations can vary greatly from study to study, ranging from common issues such as time and budget constraints to issues of sample or selection bias . For example, you may find that you didn’t manage to draw in enough respondents to achieve the desired sample size (and therefore, statistically significant results), or your sample may be skewed heavily towards a certain demographic, thereby negatively impacting representativeness .
In this section, it’s important to be critical of the shortcomings of your study. There’s no use trying to hide them (your marker will be aware of them regardless). By being critical, you’ll demonstrate to your marker that you have a strong understanding of research theory, so don’t be shy here. At the same time, don’t beat your study to death . State the limitations, why these were justified, how you mitigated their impacts to the best degree possible, and how your study still provides value despite these limitations .
Section 4 – Concluding Summary
Finally, it’s time to wrap up the methodology chapter with a brief concluding summary. In this section, you’ll want to concisely summarise what you’ve presented in the chapter. Here, it can be a good idea to use a figure to summarise the key decisions, especially if your university recommends using a specific model (for example, Saunders’ Research Onion ).
Importantly, this section needs to be brief – a paragraph or two maximum (it’s a summary, after all). Also, make sure that when you write up your concluding summary, you include only what you’ve already discussed in your chapter; don’t add any new information.

Methodology Chapter Example
In the video below, we walk you through an example of a high-quality research methodology chapter from a dissertation. We also unpack our free methodology chapter template so that you can see how best to structure your chapter.
Wrapping Up
And there you have it – the methodology chapter in a nutshell. As we’ve mentioned, the exact contents and structure of this chapter can vary between universities , so be sure to check in with your institution before you start writing. If possible, try to find dissertations or theses from former students of your specific degree program – this will give you a strong indication of the expectations and norms when it comes to the methodology chapter (and all the other chapters!).
Also, remember the golden rule of the methodology chapter – justify every choice ! Make sure that you clearly explain the “why” for every “what”, and reference credible methodology textbooks or academic sources to back up your justifications.
If you need a helping hand with your research methodology (or any other component of your research), be sure to check out our private coaching service , where we hold your hand through every step of the research journey. Until next time, good luck!

Psst... there’s more!
This post was based on one of our popular Research Bootcamps . If you're working on a research project, you'll definitely want to check this out ...
55 Comments

highly appreciated.

This was very helpful!

This was helpful

Thanks ,it is a very useful idea.
Thanks ,it is very useful idea.

Thank you so much, this information is very useful.

Thank you very much. I must say the information presented was succinct, coherent and invaluable. It is well put together and easy to comprehend. I have a great guide to create the research methodology for my dissertation.

Highly clear and useful.

I understand a bit on the explanation above. I want to have some coach but I’m still student and don’t have any budget to hire one. A lot of question I want to ask.

Thank you so much. This concluded my day plan. Thank you so much.

Thanks it was helpful

Great information. It would be great though if you could show us practical examples.

Thanks so much for this information. God bless and be with you

Thank you so so much. Indeed it was helpful

This is EXCELLENT!
I was totally confused by other explanations. Thank you so much!.

justdoing my research now , thanks for the guidance.

Thank uuuu! These contents are really valued for me!

This is powerful …I really like it

Highly useful and clear, thank you so much.

Highly appreciated. Good guide

That was helpful. Thanks

This is very useful.Thank you

Very helpful information. Thank you

This is exactly what I was looking for. The explanation is so detailed and easy to comprehend. Well done and thank you.

Great job. You just summarised everything in the easiest and most comprehensible way possible. Thanks a lot.

Thank you very much for the ideas you have given this will really help me a lot. Thank you and God Bless.

Such great effort …….very grateful thank you

Please accept my sincere gratitude. I have to say that the information that was delivered was congruent, concise, and quite helpful. It is clear and straightforward, making it simple to understand. I am in possession of an excellent manual that will assist me in developing the research methods for my dissertation.

Thank you for your great explanation. It really helped me construct my methodology paper.

thank you for simplifieng the methodoly, It was realy helpful

Very helpful!

Thank you for your great explanation.

The explanation I have been looking for. So clear Thank you

Thank you very much .this was more enlightening.

helped me create the in depth and thorough methodology for my dissertation

Thank you for the great explaination.please construct one methodology for me
I appreciate you for the explanation of methodology. Please construct one methodology on the topic: The effects influencing students dropout among schools for my thesis
This helped me complete my methods section of my dissertation with ease. I have managed to write a thorough and concise methodology!

its so good in deed

wow …what an easy to follow presentation. very invaluable content shared. utmost important.

Peace be upon you, I am Dr. Ahmed Khedr, a former part-time professor at Al-Azhar University in Cairo, Egypt. I am currently teaching research methods, and I have been dealing with your esteemed site for several years, and I found that despite my long experience with research methods sites, it is one of the smoothest sites for evaluating the material for students, For this reason, I relied on it a lot in teaching and translated most of what was written into Arabic and published it on my own page on Facebook. Thank you all… Everything I posted on my page is provided with the names of the writers of Grad coach, the title of the article, and the site. My best regards.

A remarkably simple and useful guide, thank you kindly.

I real appriciate your short and remarkable chapter summary

Bravo! Very helpful guide.

Only true experts could provide such helpful, fantastic, and inspiring knowledge about Methodology. Thank you very much! God be with you and us all!

highly appreciate your effort.

This is a very well thought out post. Very informative and a great read.

THANKS SO MUCH FOR SHARING YOUR NICE IDEA

I love you Emma, you are simply amazing with clear explanations with complete information. GradCoach really helped me to do my assignment here in Auckland. Mostly, Emma make it so simple and enjoyable

Thank you very much for this informative and synthesised version.

thank you, It was a very informative presentation, you made it just to the point in a straightforward way .

Help me write a methodology on the topic “challenges faced by family businesses in Ghana

Well articulated, clear, and concise. I got a lot from this writings. Thanks
Submit a Comment Cancel reply
Your email address will not be published. Required fields are marked *
Save my name, email, and website in this browser for the next time I comment.
- Print Friendly
Want to create or adapt books like this? Learn more about how Pressbooks supports open publishing practices.
Quantitative Data Analysis
9 Presenting the Results of Quantitative Analysis
Mikaila Mariel Lemonik Arthur
This chapter provides an overview of how to present the results of quantitative analysis, in particular how to create effective tables for displaying quantitative results and how to write quantitative research papers that effectively communicate the methods used and findings of quantitative analysis.
Writing the Quantitative Paper
Standard quantitative social science papers follow a specific format. They begin with a title page that includes a descriptive title, the author(s)’ name(s), and a 100 to 200 word abstract that summarizes the paper. Next is an introduction that makes clear the paper’s research question, details why this question is important, and previews what the paper will do. After that comes a literature review, which ends with a summary of the research question(s) and/or hypotheses. A methods section, which explains the source of data, sample, and variables and quantitative techniques used, follows. Many analysts will include a short discussion of their descriptive statistics in the methods section. A findings section details the findings of the analysis, supported by a variety of tables, and in some cases graphs, all of which are explained in the text. Some quantitative papers, especially those using more complex techniques, will include equations. Many papers follow the findings section with a discussion section, which provides an interpretation of the results in light of both the prior literature and theory presented in the literature review and the research questions/hypotheses. A conclusion ends the body of the paper. This conclusion should summarize the findings, answering the research questions and stating whether any hypotheses were supported, partially supported, or not supported. Limitations of the research are detailed. Papers typically include suggestions for future research, and where relevant, some papers include policy implications. After the body of the paper comes the works cited; some papers also have an Appendix that includes additional tables and figures that did not fit into the body of the paper or additional methodological details. While this basic format is similar for papers regardless of the type of data they utilize, there are specific concerns relating to quantitative research in terms of the methods and findings that will be discussed here.
In the methods section, researchers clearly describe the methods they used to obtain and analyze the data for their research. When relying on data collected specifically for a given paper, researchers will need to discuss the sample and data collection; in most cases, though, quantitative research relies on pre-existing datasets. In these cases, researchers need to provide information about the dataset, including the source of the data, the time it was collected, the population, and the sample size. Regardless of the source of the data, researchers need to be clear about which variables they are using in their research and any transformations or manipulations of those variables. They also need to explain the specific quantitative techniques that they are using in their analysis; if different techniques are used to test different hypotheses, this should be made clear. In some cases, publications will require that papers be submitted along with any code that was used to produce the analysis (in SPSS terms, the syntax files), which more advanced researchers will usually have on hand. In many cases, basic descriptive statistics are presented in tabular form and explained within the methods section.
The findings sections of quantitative papers are organized around explaining the results as shown in tables and figures. Not all results are depicted in tables and figures—some minor or null findings will simply be referenced—but tables and figures should be produced for all findings to be discussed at any length. If there are too many tables and figures, some can be moved to an appendix after the body of the text and referred to in the text (e.g. “See Table 12 in Appendix A”).
Discussions of the findings should not simply restate the contents of the table. Rather, they should explain and interpret it for readers, and they should do so in light of the hypothesis or hypotheses that are being tested. Conclusions—discussions of whether the hypothesis or hypotheses are supported or not supported—should wait for the conclusion of the paper.
Creating Effective Tables
When creating tables to display the results of quantitative analysis, the most important goals are to create tables that are clear and concise but that also meet standard conventions in the field. This means, first of all, paring down the volume of information produced in the statistical output to just include the information most necessary for interpreting the results, but doing so in keeping with standard table conventions. It also means making tables that are well-formatted and designed, so that readers can understand what the tables are saying without struggling to find information. For example, tables (as well as figures such as graphs) need clear captions; they are typically numbered and referred to by number in the text. Columns and rows should have clear headings. Depending on the content of the table, formatting tools may need to be used to set off header rows/columns and/or total rows/columns; cell-merging tools may be necessary; and shading may be important in tables with many rows or columns.
Here, you will find some instructions for creating tables of results from descriptive, crosstabulation, correlation, and regression analysis that are clear, concise, and meet normal standards for data display in social science. In addition, after the instructions for creating tables, you will find an example of how a paper incorporating each table might describe that table in the text.
Descriptive Statistics
When presenting the results of descriptive statistics, we create one table with columns for each type of descriptive statistic and rows for each variable. Note, of course, that depending on level of measurement only certain descriptive statistics are appropriate for a given variable, so there may be many cells in the table marked with an — to show that this statistic is not calculated for this variable. So, consider the set of descriptive statistics below, for occupational prestige, age, highest degree earned, and whether the respondent was born in this country.
To display these descriptive statistics in a paper, one might create a table like Table 2. Note that for discrete variables, we use the value label in the table, not the value.
If we were then to discuss our descriptive statistics in a quantitative paper, we might write something like this (note that we do not need to repeat every single detail from the table, as readers can peruse the table themselves): This analysis relies on four variables from the 2021 General Social Survey: occupational prestige score, age, highest degree earned, and whether the respondent was born in the United States. Descriptive statistics for all four variables are shown in Table 2. The median occupational prestige score is 47, with a range from 16 to 80. 50% of respondents had occupational prestige scores scores between 35 and 59. The median age of respondents is 53, with a range from 18 to 89. 50% of respondents are between ages 37 and 66. Both variables have little skew. Highest degree earned ranges from less than high school to a graduate degree; the median respondent has earned an associate’s degree, while the modal response (given by 39.8% of the respondents) is a high school degree. 88.8% of respondents were born in the United States. CrosstabulationWhen presenting the results of a crosstabulation, we simplify the table so that it highlights the most important information—the column percentages—and include the significance and association below the table. Consider the SPSS output below.
Table 4 shows how a table suitable for include in a paper might look if created from the SPSS output in Table 3. Note that we use asterisks to indicate the significance level of the results: * means p < 0.05; ** means p < 0.01; *** means p < 0.001; and no stars mean p > 0.05 (and thus that the result is not significant). Also note than N is the abbreviation for the number of respondents.
If we were going to discuss the results of this crosstabulation in a quantitative research paper, the discussion might look like this: A crosstabulation of respondent’s class identification and their highest degree earned, with class identification as the independent variable, is significant, with a Spearman correlation of 0.419, as shown in Table 4. Among lower class and working class respondents, more than 50% had earned a high school degree. Less than 20% of poor respondents and less than 40% of working-class respondents had earned more than a high school degree. In contrast, the majority of middle class and upper class respondents had earned at least a bachelor’s degree. In fact, 50% of upper class respondents had earned a graduate degree. CorrelationWhen presenting a correlating matrix, one of the most important things to note is that we only present half the table so as not to include duplicated results. Think of the line through the table where empty cells exist to represent the correlation between a variable and itself, and include only the triangle of data either above or below that line of cells. Consider the output in Table 5.
Table 6 shows what the contents of Table 5 might look like when a table is constructed in a fashion suitable for publication.
If we were to discuss the results of this bivariate correlation analysis in a quantitative paper, the discussion might look like this: Bivariate correlations were run among variables measuring age, occupational prestige, the highest year of school respondents completed, and family income in constant 1986 dollars, as shown in Table 6. Correlations between age and highest year of school completed and between age and family income are not significant. All other correlations are positive and significant at the p<0.001 level. The correlation between age and occupational prestige is weak; the correlations between income and occupational prestige and between income and educational attainment are moderate, and the correlation between education and occupational prestige is strong. To present the results of a regression, we create one table that includes all of the key information from the multiple tables of SPSS output. This includes the R 2 and significance of the regression, either the B or the beta values (different analysts have different preferences here) for each variable, and the standard error and significance of each variable. Consider the SPSS output in Table 7.
The regression output in shown in Table 7 contains a lot of information. We do not include all of this information when making tables suitable for publication. As can be seen in Table 8, we include the Beta (or the B), the standard error, and the significance asterisk for each variable; the R 2 and significance for the overall regression; the degrees of freedom (which tells readers the sample size or N); and the constant; along with the key to p/significance values.
If we were to discuss the results of this regression in a quantitative paper, the results might look like this: Table 8 shows the results of a regression in which age, occupational prestige, and highest year of school completed are the independent variables and family income is the dependent variable. The regression results are significant, and all of the independent variables taken together explain 15.6% of the variance in family income. Age is not a significant predictor of income, while occupational prestige and educational attainment are. Educational attainment has a larger effect on family income than does occupational prestige. For every year of additional education attained, family income goes up on average by $3,988.545; for every one-unit increase in occupational prestige score, family income goes up on average by $522.887. [1]
Social Data Analysis Copyright © 2021 by Mikaila Mariel Lemonik Arthur is licensed under a Creative Commons Attribution-NonCommercial-ShareAlike 4.0 International License , except where otherwise noted. Writing Quantitative Research Studies

1751 Accesses 1 Citations Summarizing quantitative data and its effective presentation and discussion can be challenging for students and researchers. This chapter provides a framework for adequately reporting findings from quantitative analysis in a research study for those contemplating to write a research paper. The rationale underpinning the reporting methods to maintain the credibility and integrity of quantitative studies is outlined. Commonly used terminologies in empirical studies are defined and discussed with suitable examples. Key elements that build consistency between different sections (background, methods, results, and the discussion) of a research study using quantitative methods in a journal article are explicated. Specifically, recommended standard guidelines for randomized controlled trials and observational studies for reporting and discussion of findings from quantitative studies are elaborated. Key aspects of methodology that include describing the study population, sampling strategy, data collection methods, measurements/variables, and statistical analysis which informs the quality of a study from the reviewer’s perspective are described. Effective use of references in the methods section to strengthen the rationale behind specific statistical techniques and choice of measures has been highlighted with examples. Identifying ways in which data can be most succinctly and effectively summarized in tables and graphs according to their suitability and purpose of information is also detailed in this chapter. Strategies to present and discuss the quantitative findings in a structured discussion section are also provided. Overall, the chapter provides the readers with a comprehensive set of tools to identify key strategies to be considered when reporting quantitative research. This is a preview of subscription content, log in via an institution to check access. Access this chapterSubscribe and save.
Tax calculation will be finalised at checkout Purchases are for personal use only Institutional subscriptions Similar content being viewed by others Quantitative Research Case Study 3: Application of Quantitative MethodologyBhaumik S, Arora M, Singh A, Sargent JD. Impact of entertainment media smoking on adolescent smoking behaviours. Cochrane Database Syst Rev. 2015;6:1–12. https://doi.org/10.1002/14651858.CD011720 . Article Google Scholar Dickersin K, Manheimer E, Wieland S, Robinson KA, Lefebvre C, McDonald S. Development of the Cochrane Collaboration’s CENTRAL register of controlled clinical trials. Eval Health Prof. 2002;25(1):38–64. Google Scholar Docherty M, Smith R. The case for structuring the discussion of scientific papers: much the same as that for structuring abstracts. Br Med J. 1999;318(7193):1224–5. Greenland S, Pearl J, Robins JM. Causal diagrams for epidemiologic research. Epidemiology. 1999;10(1):37–48. Horton R. The rhetoric of research. Br Med J. 1995;310(6985):985–7. Kool B, Ziersch A, Robinson P, Wolfenden L, Lowe JB. The ‘Seven deadly sins’ of rejected papers. Aust N Z J Public Health. 2016;40(1):3–4. Mannocci A, Saulle R, Colamesta V, D’Aguanno S, Giraldi G, Maffongelli E, et al. What is the impact of reporting guidelines on public health journals in Europe? The case of STROBE, CONSORT and PRISMA. J Public Health. 2015;37(4):737–40. Rothwell PM. External validity of randomised controlled trials: “to whom do the results of this trial apply?”. Lancet. 2005;365(9453):82–93. Schulz KF, Altman DG, Moher D. CONSORT 2010 statement: updated guidelines for reporting parallel group randomised trials. PLoS Med. 2010;7(3):e1000251. Szklo M. Quality of scientific articles. Rev Saude Publica. 2006;40 Spec no:30–5. Vandenbroucke JP, von Elm E, Altman DG, Gotzsche PC, Mulrow CD, Pocock SJ, et al. Strengthening the reporting of observational studies in epidemiology (STROBE): explanation and elaboration. PLoS Med. 2007;4(10):e297. Weiss NS, Koepsell TD, Psaty BM. Generalizability of the results of randomized trials. Arch Intern Med. 2008;168(2):133–5. Singh A, Gupta A, Peres MA, Watt RG, Tsakos G, Mathur MR. Association between tooth loss and hypertension among a primarily rural middle aged and older Indian adult population. J Public Health Dent. 2016;76:198–205. Download references Author informationAuthors and affiliations. Centre for Health Equity, Melbourne School of Population and Global Health, The University of Melbourne, Melbourne, VIC, Australia Ankur Singh School of Public Health, The University of Adelaide, Adelaide, SA, Australia Adyya Gupta Australian Research Centre for Population Oral Health (ARCPOH), Adelaide Dental School, The University of Adelaide, Adelaide, SA, Australia Karen G. Peres You can also search for this author in PubMed Google Scholar Corresponding authorCorrespondence to Ankur Singh . Editor informationEditors and affiliations. School of Science and Health, Western Sydney University, Penrith, NSW, Australia Pranee Liamputtong Rights and permissionsReprints and permissions Copyright information© 2019 Springer Nature Singapore Pte Ltd. About this entryCite this entry. Singh, A., Gupta, A., Peres, K.G. (2019). Writing Quantitative Research Studies. In: Liamputtong, P. (eds) Handbook of Research Methods in Health Social Sciences. Springer, Singapore. https://doi.org/10.1007/978-981-10-5251-4_117 Download citationDOI : https://doi.org/10.1007/978-981-10-5251-4_117 Published : 13 January 2019 Publisher Name : Springer, Singapore Print ISBN : 978-981-10-5250-7 Online ISBN : 978-981-10-5251-4 eBook Packages : Social Sciences Reference Module Humanities and Social Sciences Reference Module Business, Economics and Social Sciences Share this entryAnyone you share the following link with will be able to read this content: Sorry, a shareable link is not currently available for this article. Provided by the Springer Nature SharedIt content-sharing initiative
Policies and ethics
A Scholar’s Guide to Writing the Methods Section of a Research PaperTable of contents
In the vast realm of academic writing, the research paper stands as a testament to a scholar’s systematic exploration of a particular subject. Each section of the paper plays a pivotal role, knitting together the fabric of the study. While the introduction sets the stage and the results showcase the findings, it is the Methods section that forms the backbone, providing a clear roadmap for any reader or researcher wishing to replicate or understand the study’s inner workings. As pivotal as it is, crafting an impeccable Methods section often poses challenges for researchers. This article aims to elucidate the intricacies of constructing a robust Methodology section in a research paper. After reading our guide, you will:
Now, let’s take a detailed look at these points! What Is the Methods Section of a Research PaperDo you have any questions about how to write the Methodology? Firstly, let’s define this section for research. The Methods or Methodology section of the research paper gives the road map for how the research was conducted. A well-crafted Methods section not only guides the researcher but also helps other scholars understand, replicate your study. In other words, it’s like a recipe in a cookbook. If you want others to recreate your experiment or study, this section tells them exactly how you did it. It includes details about the steps you took, the tools or ingredients you used, and how you measured your results. This way, others can see if they get the same outcome when they follow your “recipe” or if they can trust your findings. This means that the Methodology should be thoughtfully planned, executed, and reported. The reader should understand the basic research structure and the steps taken to conduct the study, including the research design, methods, gathered data, and data analysis techniques used. The Methodology of a research study is essential for several reasons: Validity and Reliability: A well-defined Methodology provides the foundation for the criteria and reliability of the study, particularly in addressing the research question for research. It helps to ensure that the research is conducted in a systematic and controlled manner and that the results are accurate and trustworthy. Replicability: It allows other researchers to understand and replicate the study, which is important for building on existing knowledge and advancing the field. Clarity and Transparency: A clear and concise Methods part makes it easier for readers to understand the research process and evaluate the results. This helps to increase transparency and build trust in the findings. Justification of Approach: The research methodology provides a rationale for the approach taken, including why certain methods and techniques were chosen and how they relate to the question for research. Evidence of Rigor: A well-executed research methodology demonstrates the rigor and thoroughness of the study, which is important for establishing the credibility of the results. Methodology vs. MethodsIn rigorous academic and research contexts, there is a distinction between “methods” and “methodology.” However, outside of strict scholarly circles or in more informal discussions, there might be some overlapping use. The “methods” generally refer to the specific techniques or procedures, while “methodology” dives into the theoretical framework and rationale behind those techniques. It’s essential to use the terms correctly in formal academic and research writings to maintain clarity and precision. Nevertheless, in many research papers, the specifics of the methods (the “how”) are the primary focus, and the theoretical rationale (the “why”) might be briefly touched upon within the same section. Structure of the Methodology In A Research PaperThe Methods section typically begins with a brief overview of its contents and a reiteration of the research question. This is followed by a description of the participants, detailing their demographics, and how they were recruited. The materials or apparatus used are then specified, from tools to equipment, with any unique specifications highlighted. The core of the Methods section is the procedure, a step-by-step account of the study, from experimental tasks to the sequence of operations. This is complemented by an explanation of the experimental design, where the type of research design is described, along with the variables involved. Detailed accounts of how data was gathered, whether through surveys, interviews, or other methods, are provided, ensuring the reader understands the data collection nuances. Critical to the credibility of the study is the section on statistical analysis, which reveals how data was processed, what statistical tests were used, and the software or tools employed. If the research involved humans or animals, the ethical considerations section becomes pivotal. Here, measures taken to ensure participants’ rights, confidentiality, and informed consent are documented. Towards the end, the limitations of the study are discussed, providing insights into potential biases or constraints faced during the research process. The section wraps up with a brief recap, emphasizing the methods’ role in ensuring the study’s integrity and reproducibility. According to APA style , there are three major subsections to report here: participants, apparatus, and procedure. ParticipantsThis segment reports the characteristics of the participants involved in the experiment, the method of sampling, and the sample size.
This details the demography of the respondents that may be relevant to the experiment. This includes but is not limited to age, gender, ethnicity or race, religion, level of education, socioeconomic status, origin of the population, and any restrictions. ✏️Example: Fifty female undergraduate students between the ages of 19 and 23 participated in the experiment. All were sophomores in the Faculty of Engineering and native English speakers who lived on the university campus. The participants were separated into two groups of 25 students, each without any determining criteria. This study was conducted at the University of Alabama, USA .
Identify the selection criteria and whether the sample was random or not. Include it if you have access to data informing the percentage of people invited to participate and how many agreed. You should also report the selection mode; was it voluntary, or were the participants assigned to the study? Additionally, identify any compensation that was provided to participants. The ethics board was petitioned, and approval was granted before the recruitment of participants commenced. All the female sophomores from the faculty of Engineering at the University of Alabama, USA, were invited to participate, and those who did were self-selected. In liaison with department heads, the students were offered additional credits in a faculty-wide course as compensation for their time.
Identify the sample size per group, the statistical power you aimed to attain, whether you could attain it, and the analyses you used to determine the figures you arrived at. You should also include whether the final sample you got was what you initially required. The required power for this experiment to detect a 15% effect at a significance level of .08 was 75%. To achieve this, we needed 25 participants in each group. The final sample met these conditions. This subsection describes the materials and apparatus used in the experiment. It calls for detailed information on all devices and techniques used to collate data, measure suitable variables, and reach analysis, including tests and surveys. You must include a proper count of the number of apparatus used, their names, model number, manufacturer, reliability, and validity. For surveys, including the meaning of the formats used and the number of questions asked. A survey that consisted of 15 multiple-choice questions was carried out to determine the safety of female students on the school campus. The participants were asked to answer the questions using a 5-point grading system (1 = Extremely True and 5 = Extremely False). This includes the conditions in which data was collated, instructions given to the participants, and data analysis methods. The two groups of participants were placed in two different classrooms at individual desks and given 10 minutes to answer the questions. They were instructed to give the first answers they thought of without thinking too deeply. Each group had a supervisor attached to it. Writing a research paper requires a great deal of skill and knowledge, so if you need help compiling the Methods section of your paper, consider using a professional coursework writing service to help you. Advice On How to Write the Methods SectionYou already know the relevance of the Methods part to your research paper. Additionally, you must adhere to formatting guidelines specific for your field. If you cannot write according to standards, you can use a research paper writing service to get good results. Go for one with good reviews and a super online reputation. Here are some more tips for a concise and meticulously written Methodology:
Methods and Results Should MatchIn the Methods section, the results obtained should be discussed based on the experimental procedures used. Explain the methodology behind the techniques used to acquire all the observations and results of the experiment in the right order. You can create a detailed flowchart or block flow diagram (BFD) to easily describe the complexities of the study and its procedures to the reader. Preparing the Statistical Methods SubsectionThe statistical analysis subsection comes at the end of the Methods section. It includes a thorough description of the analyzed data to arrive at the results and conclusion. Due to its technicality, it might be a little difficult and daunting to write. If this is the case, you can get the statistician who participated in the study to write it. Here, you must indicate all the data variables, including the control variables, dependent and independent variables, and any potentially irrelevant variables that could affect your results and conclusion. Specify the exact tests carried out on the different types of data you have, the requirements you tested, like distribution normality, and all assumptions you initially applied. You should also include all data alterations, possible mix-ups, confidence intervals or significance levels used, techniques for data analysis, and ensuing statistical tests that were employed. Furthermore, specify any criteria particular to the experiment, like set baselines and any specific software used to conduct the statistical analysis. The Style of the MethodologyAs mentioned earlier, it aims to explain how and why the experiment was carried out so that readers can understand it and possibly repeat the procedure. Therefore, it is essential to be aware of your audience so you can modify your writing based on what they know and explain technical terms where necessary. If you are finding it difficult to write in the appropriate style, you can buy a research paper written by writers. You can find these writers on several platforms for college essays. The methodology should read as though you describe the experiment to your reader. For this reason, it should be worded in third-person constructs and a passive voice. For example, you should use “We carried out a survey” and not “I carried out a survey.” Since the experiment has already been carried out, you must write the entire section in the past tense. Key Information to Include in MethodologyNow you know what the Methods section is, what information must be included in this segment of your paper? Here’s a summary of the things you need to include:
Helping Hand in Writing Methodology ChapterIt can be challenging for researchers to adequately describe their study methodologies and strategies when writing the methodology chapter of a research report. Organizing and presenting complex material, retaining clarity and conciseness, and describing technical processes or approaches are among the usual difficulties. To overcome these challenges, researchers can consider seeking feedback from peers, utilizing a https://papersowl.com/ or editor, and thoroughly reviewing and revising their methodology chapter multiple times. With the help of an essay writing service, you can ensure that your research paper is accurate and successful. Which information is not included in the methodology section of a research article?Where does the research methodology section go in a research paper, what is the difference between qualitative and quantitative methods, readers also enjoyed.  WHY WAIT? PLACE AN ORDER RIGHT NOW!Just fill out the form, press the button, and have no worries! We use cookies to give you the best experience possible. By continuing we’ll assume you board with our cookie policy.  An official website of the United States government The .gov means it’s official. Federal government websites often end in .gov or .mil. Before sharing sensitive information, make sure you’re on a federal government site. The site is secure. The https:// ensures that you are connecting to the official website and that any information you provide is encrypted and transmitted securely.
Preview improvements coming to the PMC website in October 2024. Learn More or Try it out now .
A Practical Guide to Writing Quantitative and Qualitative Research Questions and Hypotheses in Scholarly ArticlesEdward barroga. 1 Department of General Education, Graduate School of Nursing Science, St. Luke’s International University, Tokyo, Japan. Glafera Janet Matanguihan2 Department of Biological Sciences, Messiah University, Mechanicsburg, PA, USA. The development of research questions and the subsequent hypotheses are prerequisites to defining the main research purpose and specific objectives of a study. Consequently, these objectives determine the study design and research outcome. The development of research questions is a process based on knowledge of current trends, cutting-edge studies, and technological advances in the research field. Excellent research questions are focused and require a comprehensive literature search and in-depth understanding of the problem being investigated. Initially, research questions may be written as descriptive questions which could be developed into inferential questions. These questions must be specific and concise to provide a clear foundation for developing hypotheses. Hypotheses are more formal predictions about the research outcomes. These specify the possible results that may or may not be expected regarding the relationship between groups. Thus, research questions and hypotheses clarify the main purpose and specific objectives of the study, which in turn dictate the design of the study, its direction, and outcome. Studies developed from good research questions and hypotheses will have trustworthy outcomes with wide-ranging social and health implications. INTRODUCTIONScientific research is usually initiated by posing evidenced-based research questions which are then explicitly restated as hypotheses. 1 , 2 The hypotheses provide directions to guide the study, solutions, explanations, and expected results. 3 , 4 Both research questions and hypotheses are essentially formulated based on conventional theories and real-world processes, which allow the inception of novel studies and the ethical testing of ideas. 5 , 6 It is crucial to have knowledge of both quantitative and qualitative research 2 as both types of research involve writing research questions and hypotheses. 7 However, these crucial elements of research are sometimes overlooked; if not overlooked, then framed without the forethought and meticulous attention it needs. Planning and careful consideration are needed when developing quantitative or qualitative research, particularly when conceptualizing research questions and hypotheses. 4 There is a continuing need to support researchers in the creation of innovative research questions and hypotheses, as well as for journal articles that carefully review these elements. 1 When research questions and hypotheses are not carefully thought of, unethical studies and poor outcomes usually ensue. Carefully formulated research questions and hypotheses define well-founded objectives, which in turn determine the appropriate design, course, and outcome of the study. This article then aims to discuss in detail the various aspects of crafting research questions and hypotheses, with the goal of guiding researchers as they develop their own. Examples from the authors and peer-reviewed scientific articles in the healthcare field are provided to illustrate key points. DEFINITIONS AND RELATIONSHIP OF RESEARCH QUESTIONS AND HYPOTHESESA research question is what a study aims to answer after data analysis and interpretation. The answer is written in length in the discussion section of the paper. Thus, the research question gives a preview of the different parts and variables of the study meant to address the problem posed in the research question. 1 An excellent research question clarifies the research writing while facilitating understanding of the research topic, objective, scope, and limitations of the study. 5 On the other hand, a research hypothesis is an educated statement of an expected outcome. This statement is based on background research and current knowledge. 8 , 9 The research hypothesis makes a specific prediction about a new phenomenon 10 or a formal statement on the expected relationship between an independent variable and a dependent variable. 3 , 11 It provides a tentative answer to the research question to be tested or explored. 4 Hypotheses employ reasoning to predict a theory-based outcome. 10 These can also be developed from theories by focusing on components of theories that have not yet been observed. 10 The validity of hypotheses is often based on the testability of the prediction made in a reproducible experiment. 8 Conversely, hypotheses can also be rephrased as research questions. Several hypotheses based on existing theories and knowledge may be needed to answer a research question. Developing ethical research questions and hypotheses creates a research design that has logical relationships among variables. These relationships serve as a solid foundation for the conduct of the study. 4 , 11 Haphazardly constructed research questions can result in poorly formulated hypotheses and improper study designs, leading to unreliable results. Thus, the formulations of relevant research questions and verifiable hypotheses are crucial when beginning research. 12 CHARACTERISTICS OF GOOD RESEARCH QUESTIONS AND HYPOTHESESExcellent research questions are specific and focused. These integrate collective data and observations to confirm or refute the subsequent hypotheses. Well-constructed hypotheses are based on previous reports and verify the research context. These are realistic, in-depth, sufficiently complex, and reproducible. More importantly, these hypotheses can be addressed and tested. 13 There are several characteristics of well-developed hypotheses. Good hypotheses are 1) empirically testable 7 , 10 , 11 , 13 ; 2) backed by preliminary evidence 9 ; 3) testable by ethical research 7 , 9 ; 4) based on original ideas 9 ; 5) have evidenced-based logical reasoning 10 ; and 6) can be predicted. 11 Good hypotheses can infer ethical and positive implications, indicating the presence of a relationship or effect relevant to the research theme. 7 , 11 These are initially developed from a general theory and branch into specific hypotheses by deductive reasoning. In the absence of a theory to base the hypotheses, inductive reasoning based on specific observations or findings form more general hypotheses. 10 TYPES OF RESEARCH QUESTIONS AND HYPOTHESESResearch questions and hypotheses are developed according to the type of research, which can be broadly classified into quantitative and qualitative research. We provide a summary of the types of research questions and hypotheses under quantitative and qualitative research categories in Table 1 .
Research questions in quantitative researchIn quantitative research, research questions inquire about the relationships among variables being investigated and are usually framed at the start of the study. These are precise and typically linked to the subject population, dependent and independent variables, and research design. 1 Research questions may also attempt to describe the behavior of a population in relation to one or more variables, or describe the characteristics of variables to be measured ( descriptive research questions ). 1 , 5 , 14 These questions may also aim to discover differences between groups within the context of an outcome variable ( comparative research questions ), 1 , 5 , 14 or elucidate trends and interactions among variables ( relationship research questions ). 1 , 5 We provide examples of descriptive, comparative, and relationship research questions in quantitative research in Table 2 .
Hypotheses in quantitative researchIn quantitative research, hypotheses predict the expected relationships among variables. 15 Relationships among variables that can be predicted include 1) between a single dependent variable and a single independent variable ( simple hypothesis ) or 2) between two or more independent and dependent variables ( complex hypothesis ). 4 , 11 Hypotheses may also specify the expected direction to be followed and imply an intellectual commitment to a particular outcome ( directional hypothesis ) 4 . On the other hand, hypotheses may not predict the exact direction and are used in the absence of a theory, or when findings contradict previous studies ( non-directional hypothesis ). 4 In addition, hypotheses can 1) define interdependency between variables ( associative hypothesis ), 4 2) propose an effect on the dependent variable from manipulation of the independent variable ( causal hypothesis ), 4 3) state a negative relationship between two variables ( null hypothesis ), 4 , 11 , 15 4) replace the working hypothesis if rejected ( alternative hypothesis ), 15 explain the relationship of phenomena to possibly generate a theory ( working hypothesis ), 11 5) involve quantifiable variables that can be tested statistically ( statistical hypothesis ), 11 6) or express a relationship whose interlinks can be verified logically ( logical hypothesis ). 11 We provide examples of simple, complex, directional, non-directional, associative, causal, null, alternative, working, statistical, and logical hypotheses in quantitative research, as well as the definition of quantitative hypothesis-testing research in Table 3 .
Research questions in qualitative researchUnlike research questions in quantitative research, research questions in qualitative research are usually continuously reviewed and reformulated. The central question and associated subquestions are stated more than the hypotheses. 15 The central question broadly explores a complex set of factors surrounding the central phenomenon, aiming to present the varied perspectives of participants. 15 There are varied goals for which qualitative research questions are developed. These questions can function in several ways, such as to 1) identify and describe existing conditions ( contextual research question s); 2) describe a phenomenon ( descriptive research questions ); 3) assess the effectiveness of existing methods, protocols, theories, or procedures ( evaluation research questions ); 4) examine a phenomenon or analyze the reasons or relationships between subjects or phenomena ( explanatory research questions ); or 5) focus on unknown aspects of a particular topic ( exploratory research questions ). 5 In addition, some qualitative research questions provide new ideas for the development of theories and actions ( generative research questions ) or advance specific ideologies of a position ( ideological research questions ). 1 Other qualitative research questions may build on a body of existing literature and become working guidelines ( ethnographic research questions ). Research questions may also be broadly stated without specific reference to the existing literature or a typology of questions ( phenomenological research questions ), may be directed towards generating a theory of some process ( grounded theory questions ), or may address a description of the case and the emerging themes ( qualitative case study questions ). 15 We provide examples of contextual, descriptive, evaluation, explanatory, exploratory, generative, ideological, ethnographic, phenomenological, grounded theory, and qualitative case study research questions in qualitative research in Table 4 , and the definition of qualitative hypothesis-generating research in Table 5 .
Qualitative studies usually pose at least one central research question and several subquestions starting with How or What . These research questions use exploratory verbs such as explore or describe . These also focus on one central phenomenon of interest, and may mention the participants and research site. 15 Hypotheses in qualitative researchHypotheses in qualitative research are stated in the form of a clear statement concerning the problem to be investigated. Unlike in quantitative research where hypotheses are usually developed to be tested, qualitative research can lead to both hypothesis-testing and hypothesis-generating outcomes. 2 When studies require both quantitative and qualitative research questions, this suggests an integrative process between both research methods wherein a single mixed-methods research question can be developed. 1 FRAMEWORKS FOR DEVELOPING RESEARCH QUESTIONS AND HYPOTHESESResearch questions followed by hypotheses should be developed before the start of the study. 1 , 12 , 14 It is crucial to develop feasible research questions on a topic that is interesting to both the researcher and the scientific community. This can be achieved by a meticulous review of previous and current studies to establish a novel topic. Specific areas are subsequently focused on to generate ethical research questions. The relevance of the research questions is evaluated in terms of clarity of the resulting data, specificity of the methodology, objectivity of the outcome, depth of the research, and impact of the study. 1 , 5 These aspects constitute the FINER criteria (i.e., Feasible, Interesting, Novel, Ethical, and Relevant). 1 Clarity and effectiveness are achieved if research questions meet the FINER criteria. In addition to the FINER criteria, Ratan et al. described focus, complexity, novelty, feasibility, and measurability for evaluating the effectiveness of research questions. 14 The PICOT and PEO frameworks are also used when developing research questions. 1 The following elements are addressed in these frameworks, PICOT: P-population/patients/problem, I-intervention or indicator being studied, C-comparison group, O-outcome of interest, and T-timeframe of the study; PEO: P-population being studied, E-exposure to preexisting conditions, and O-outcome of interest. 1 Research questions are also considered good if these meet the “FINERMAPS” framework: Feasible, Interesting, Novel, Ethical, Relevant, Manageable, Appropriate, Potential value/publishable, and Systematic. 14 As we indicated earlier, research questions and hypotheses that are not carefully formulated result in unethical studies or poor outcomes. To illustrate this, we provide some examples of ambiguous research question and hypotheses that result in unclear and weak research objectives in quantitative research ( Table 6 ) 16 and qualitative research ( Table 7 ) 17 , and how to transform these ambiguous research question(s) and hypothesis(es) into clear and good statements.
a These statements were composed for comparison and illustrative purposes only. b These statements are direct quotes from Higashihara and Horiuchi. 16
a This statement is a direct quote from Shimoda et al. 17 The other statements were composed for comparison and illustrative purposes only. CONSTRUCTING RESEARCH QUESTIONS AND HYPOTHESESTo construct effective research questions and hypotheses, it is very important to 1) clarify the background and 2) identify the research problem at the outset of the research, within a specific timeframe. 9 Then, 3) review or conduct preliminary research to collect all available knowledge about the possible research questions by studying theories and previous studies. 18 Afterwards, 4) construct research questions to investigate the research problem. Identify variables to be accessed from the research questions 4 and make operational definitions of constructs from the research problem and questions. Thereafter, 5) construct specific deductive or inductive predictions in the form of hypotheses. 4 Finally, 6) state the study aims . This general flow for constructing effective research questions and hypotheses prior to conducting research is shown in Fig. 1 .  Research questions are used more frequently in qualitative research than objectives or hypotheses. 3 These questions seek to discover, understand, explore or describe experiences by asking “What” or “How.” The questions are open-ended to elicit a description rather than to relate variables or compare groups. The questions are continually reviewed, reformulated, and changed during the qualitative study. 3 Research questions are also used more frequently in survey projects than hypotheses in experiments in quantitative research to compare variables and their relationships. Hypotheses are constructed based on the variables identified and as an if-then statement, following the template, ‘If a specific action is taken, then a certain outcome is expected.’ At this stage, some ideas regarding expectations from the research to be conducted must be drawn. 18 Then, the variables to be manipulated (independent) and influenced (dependent) are defined. 4 Thereafter, the hypothesis is stated and refined, and reproducible data tailored to the hypothesis are identified, collected, and analyzed. 4 The hypotheses must be testable and specific, 18 and should describe the variables and their relationships, the specific group being studied, and the predicted research outcome. 18 Hypotheses construction involves a testable proposition to be deduced from theory, and independent and dependent variables to be separated and measured separately. 3 Therefore, good hypotheses must be based on good research questions constructed at the start of a study or trial. 12 In summary, research questions are constructed after establishing the background of the study. Hypotheses are then developed based on the research questions. Thus, it is crucial to have excellent research questions to generate superior hypotheses. In turn, these would determine the research objectives and the design of the study, and ultimately, the outcome of the research. 12 Algorithms for building research questions and hypotheses are shown in Fig. 2 for quantitative research and in Fig. 3 for qualitative research.  EXAMPLES OF RESEARCH QUESTIONS FROM PUBLISHED ARTICLES
EXAMPLES OF HYPOTHESES IN PUBLISHED ARTICLES
EXAMPLES OF HYPOTHESIS AS WRITTEN IN PUBLISHED ARTICLES IN RELATION TO OTHER PARTS
Research questions and hypotheses are crucial components to any type of research, whether quantitative or qualitative. These questions should be developed at the very beginning of the study. Excellent research questions lead to superior hypotheses, which, like a compass, set the direction of research, and can often determine the successful conduct of the study. Many research studies have floundered because the development of research questions and subsequent hypotheses was not given the thought and meticulous attention needed. The development of research questions and hypotheses is an iterative process based on extensive knowledge of the literature and insightful grasp of the knowledge gap. Focused, concise, and specific research questions provide a strong foundation for constructing hypotheses which serve as formal predictions about the research outcomes. Research questions and hypotheses are crucial elements of research that should not be overlooked. They should be carefully thought of and constructed when planning research. This avoids unethical studies and poor outcomes by defining well-founded objectives that determine the design, course, and outcome of the study. Disclosure: The authors have no potential conflicts of interest to disclose. Author Contributions:
Generate accurate APA citations for free
Reporting Research Results in APA Style | Tips & ExamplesPublished on December 21, 2020 by Pritha Bhandari . Revised on January 17, 2024. The results section of a quantitative research paper is where you summarize your data and report the findings of any relevant statistical analyses. The APA manual provides rigorous guidelines for what to report in quantitative research papers in the fields of psychology, education, and other social sciences. Use these standards to answer your research questions and report your data analyses in a complete and transparent way. Instantly correct all language mistakes in your textUpload your document to correct all your mistakes in minutes  Table of contentsWhat goes in your results section, introduce your data, summarize your data, report statistical results, presenting numbers effectively, what doesn’t belong in your results section, frequently asked questions about results in apa. In APA style, the results section includes preliminary information about the participants and data, descriptive and inferential statistics, and the results of any exploratory analyses. Include these in your results section:
Write up the results in the past tense because you’re describing the outcomes of a completed research study. Are your APA in-text citations flawless?The AI-powered APA Citation Checker points out every error, tells you exactly what’s wrong, and explains how to fix it. Say goodbye to losing marks on your assignment! Get started!  Before diving into your research findings, first describe the flow of participants at every stage of your study and whether any data were excluded from the final analysis. Participant flow and recruitment periodIt’s necessary to report any attrition, which is the decline in participants at every sequential stage of a study. That’s because an uneven number of participants across groups sometimes threatens internal validity and makes it difficult to compare groups. Be sure to also state all reasons for attrition. If your study has multiple stages (e.g., pre-test, intervention, and post-test) and groups (e.g., experimental and control groups), a flow chart is the best way to report the number of participants in each group per stage and reasons for attrition. Also report the dates for when you recruited participants or performed follow-up sessions. Missing dataAnother key issue is the completeness of your dataset. It’s necessary to report both the amount and reasons for data that was missing or excluded. Data can become unusable due to equipment malfunctions, improper storage, unexpected events, participant ineligibility, and so on. For each case, state the reason why the data were unusable. Some data points may be removed from the final analysis because they are outliers—but you must be able to justify how you decided what to exclude. If you applied any techniques for overcoming or compensating for lost data, report those as well. Adverse eventsFor clinical studies, report all events with serious consequences or any side effects that occured. Descriptive statistics summarize your data for the reader. Present descriptive statistics for each primary, secondary, and subgroup analysis. Don’t provide formulas or citations for commonly used statistics (e.g., standard deviation) – but do provide them for new or rare equations. Descriptive statisticsThe exact descriptive statistics that you report depends on the types of data in your study. Categorical variables can be reported using proportions, while quantitative data can be reported using means and standard deviations . For a large set of numbers, a table is the most effective presentation format. Include sample sizes (overall and for each group) as well as appropriate measures of central tendency and variability for the outcomes in your results section. For every point estimate , add a clearly labelled measure of variability as well. Be sure to note how you combined data to come up with variables of interest. For every variable of interest, explain how you operationalized it. According to APA journal standards, it’s necessary to report all relevant hypothesis tests performed, estimates of effect sizes, and confidence intervals. When reporting statistical results, you should first address primary research questions before moving onto secondary research questions and any exploratory or subgroup analyses. Present the results of tests in the order that you performed them—report the outcomes of main tests before post-hoc tests, for example. Don’t leave out any relevant results, even if they don’t support your hypothesis. Inferential statisticsFor each statistical test performed, first restate the hypothesis , then state whether your hypothesis was supported and provide the outcomes that led you to that conclusion. Report the following for each hypothesis test:
When reporting complex data analyses, such as factor analysis or multivariate analysis, present the models estimated in detail, and state the statistical software used. Make sure to report any violations of statistical assumptions or problems with estimation. Effect sizes and confidence intervalsFor each hypothesis test performed, you should present confidence intervals and estimates of effect sizes . Confidence intervals are useful for showing the variability around point estimates. They should be included whenever you report population parameter estimates. Effect sizes indicate how impactful the outcomes of a study are. But since they are estimates, it’s recommended that you also provide confidence intervals of effect sizes. Subgroup or exploratory analysesBriefly report the results of any other planned or exploratory analyses you performed. These may include subgroup analyses as well. Subgroup analyses come with a high chance of false positive results, because performing a large number of comparison or correlation tests increases the chances of finding significant results. If you find significant results in these analyses, make sure to appropriately report them as exploratory (rather than confirmatory) results to avoid overstating their importance. While these analyses can be reported in less detail in the main text, you can provide the full analyses in supplementary materials. Scribbr Citation Checker NewThe AI-powered Citation Checker helps you avoid common mistakes such as:
To effectively present numbers, use a mix of text, tables , and figures where appropriate:
Since these are general guidelines, use your own judgment and feedback from others for effective presentation of numbers. Tables and figures should be numbered and have titles, along with relevant notes. Make sure to present data only once throughout the paper and refer to any tables and figures in the text. Formatting statistics and numbersIt’s important to follow capitalization , italicization, and abbreviation rules when referring to statistics in your paper. There are specific format guidelines for reporting statistics in APA , as well as general rules about writing numbers . If you are unsure of how to present specific symbols, look up the detailed APA guidelines or other papers in your field. It’s important to provide a complete picture of your data analyses and outcomes in a concise way. For that reason, raw data and any interpretations of your results are not included in the results section. It’s rarely appropriate to include raw data in your results section. Instead, you should always save the raw data securely and make them available and accessible to any other researchers who request them. Making scientific research available to others is a key part of academic integrity and open science. Interpretation or discussion of resultsThis belongs in your discussion section. Your results section is where you objectively report all relevant findings and leave them open for interpretation by readers. While you should state whether the findings of statistical tests lend support to your hypotheses, refrain from forming conclusions to your research questions in the results section. Explanation of how statistics tests workFor the sake of concise writing, you can safely assume that readers of your paper have professional knowledge of how statistical inferences work. In an APA results section , you should generally report the following:
According to the APA guidelines, you should report enough detail on inferential statistics so that your readers understand your analyses.
You should also present confidence intervals and estimates of effect sizes where relevant. In APA style, statistics can be presented in the main text or as tables or figures . To decide how to present numbers, you can follow APA guidelines:
Results are usually written in the past tense , because they are describing the outcome of completed actions. The results chapter or section simply and objectively reports what you found, without speculating on why you found these results. The discussion interprets the meaning of the results, puts them in context, and explains why they matter. In qualitative research , results and discussion are sometimes combined. But in quantitative research , it’s considered important to separate the objective results from your interpretation of them. Cite this Scribbr articleIf you want to cite this source, you can copy and paste the citation or click the “Cite this Scribbr article” button to automatically add the citation to our free Citation Generator. Bhandari, P. (2024, January 17). Reporting Research Results in APA Style | Tips & Examples. Scribbr. Retrieved August 27, 2024, from https://www.scribbr.com/apa-style/results-section/ Is this article helpful? Pritha BhandariOther students also liked, how to write an apa methods section, how to format tables and figures in apa style, reporting statistics in apa style | guidelines & examples, scribbr apa citation checker. An innovative new tool that checks your APA citations with AI software. Say goodbye to inaccurate citations! How to write the methods section of a research paper

Discover the world's research


Methods for Quantitative Research in Psychology
Psychological Research August 2023 This seven-hour course provides a comprehensive exploration of research methodologies, beginning with the foundational steps of the scientific method. Students will learn about hypotheses, experimental design, data collection, and the analysis of results. Emphasis is placed on defining variables accurately, distinguishing between independent, dependent, and controlled variables, and understanding their roles in research. The course delves into major research designs, including experimental, correlational, and observational studies. Students will compare and contrast these designs, evaluating their strengths and weaknesses in various contexts. This comparison extends to the types of research questions scientists pose, highlighting how different designs are suited to different inquiries. A critical component of the course is developing the ability to judge the quality of sources for literature reviews. Students will learn criteria for evaluating the credibility, relevance, and reliability of sources, ensuring that their understanding of the research literature is built on a solid foundation. Reliability and validity are key concepts addressed in the course. Students will explore what it means for an observation to be reliable, focusing on consistency and repeatability. They will also compare and contrast different forms of validity, such as internal, external, construct, and criterion validity, and how these apply to various research designs. The course concepts are thoroughly couched in examples drawn from the psychological research literature. By the end of the course, students will be equipped with the skills to design robust research studies, critically evaluate sources, and understand the nuances of reliability and validity in scientific research. This knowledge will be essential for conducting high-quality research and contributing to the scientific community. Learning objectives
This program does not offer CE credit. More in this seriesIntroduces applying statistical methods effectively in psychology or related fields for undergraduates, high school students, and professionals. August 2023 On Demand Training Introduces the importance of ethical practice in scientific research for undergraduates, high school students, and professionals. An official website of the United States government The .gov means it’s official. Federal government websites often end in .gov or .mil. Before sharing sensitive information, make sure you’re on a federal government site. The site is secure. The https:// ensures that you are connecting to the official website and that any information you provide is encrypted and transmitted securely.
Save citation to fileEmail citation, add to collections.
Add to My BibliographyYour saved search, create a file for external citation management software, your rss feed.
How to Write the Methods Section of a Research ManuscriptAffiliation.
The methods section of a manuscript is one of the most important parts of a research paper because it provides information on the validity of the study and credibility of the results. Inadequate description of the methods has been reported as one of the main reasons for manuscript rejection. The methods section must include sufficient detail so that others could repeat the study and reproduce the results. The structure of the methods section should flow logically and chronologically. There are multiple components of methods sections, including study design, materials used, study procedures, and data analysis. Each element must be adequately described and thoroughly detailed to provide an understanding of how the results were obtained and how to interpret the findings. Studies that involved humans or animals must include an ethics statement of approval from the appropriate governing body. The methods section should explain how subjects were identified and should state inclusion and exclusion criteria. All materials used to complete the study should be described in detail, including equipment, drugs, gases, chemicals, treatments, interventions, or other items. Study procedures should outline all steps taken to obtain the results and clearly state the outcome measures. Subheadings might be helpful for organizing the methods section into subsections when there is a considerable amount of information to report. A well-written methods section will guide the reader through the research process and provide adequate information to evaluate study validity and reproduce the work. The purpose of this paper is to provide guidance for writing the methods section of a manuscript. Keywords: manuscript; methods; publication; research; research paper; science writing; study protocol. Copyright © 2023 by Daedalus Enterprises. PubMed Disclaimer Conflict of interest statementMs Willis is a Section Editor for Respiratory Care. Similar articles
Related informationLinkout - more resources, full text sources.
NCBI Literature Resources MeSH PMC Bookshelf Disclaimer The PubMed wordmark and PubMed logo are registered trademarks of the U.S. Department of Health and Human Services (HHS). Unauthorized use of these marks is strictly prohibited.
Organizing Your Social Sciences Research Paper
Reading a Scholarly Article or Research PaperIdentifying a research problem to investigate requires a preliminary search for and critical review of the literature in order to gain an understanding about how scholars have examined a topic. Scholars rarely structure research studies in a way that can be followed like a story; they are complex and detail-intensive and often written in a descriptive and conclusive narrative form. However, in the social and behavioral sciences, journal articles and stand-alone research reports are generally organized in a consistent format that makes it easier to compare and contrast studies and interpret their findings. General Reading Strategies W hen you first read an article or research paper, focus on asking specific questions about each section. This strategy can help with overall comprehension and with understanding how the content relates [or does not relate] to the problem you want to investigate. As you review more and more studies, the process of understanding and critically evaluating the research will become easier because the content of what you review will begin to coalescence around common themes and patterns of analysis. Below are recommendations on how to read each section of a research paper effectively. Note that the sections to read are out of order from how you will find them organized in a journal article or research paper. 1. Abstract The abstract summarizes the background, methods, results, discussion, and conclusions of a scholarly article or research paper. Use the abstract to filter out sources that may have appeared useful when you began searching for information but, in reality, are not relevant. Questions to consider when reading the abstract are:
2. Introduction If, after reading the abstract, you believe the paper may be useful, focus on examining the research problem and identifying the questions the author is trying to address. This information is usually located within the first few paragraphs of the introduction or in the concluding paragraph. Look for information about how and in what way this relates to what you are investigating. In addition to the research problem, the introduction should provide the main argument and theoretical framework of the study and, in the last paragraphs of the introduction, describe what the author(s) intend to accomplish. Questions to consider when reading the introduction include:
3. Literature Review The literature review describes and critically evaluates what is already known about a topic. Read the literature review to obtain a big picture perspective about how the topic has been studied and to begin the process of seeing where your potential study fits within the domain of prior research. Questions to consider when reading the literature review include:
4. Discussion/Conclusion The discussion and conclusion are usually the last two sections of text in a scholarly article or research report. They reveal how the author(s) interpreted the findings of their research and presented recommendations or courses of action based on those findings. Often in the conclusion, the author(s) highlight recommendations for further research that can be used to develop your own study. Questions to consider when reading the discussion and conclusion sections include:
5. Methods/Methodology The methods section describes the materials, techniques, and procedures for gathering information used to examine the research problem. If what you have read so far closely supports your understanding of the topic, then move on to examining how the author(s) gathered information during the research process. Questions to consider when reading the methods section include:
6. Results After reading the above sections, you should have a clear understanding of the general findings of the study. Therefore, read the results section to identify how key findings were discussed in relation to the research problem. If any non-textual elements [e.g., graphs, charts, tables, etc.] are confusing, focus on the explanations about them in the text. Questions to consider when reading the results section include:
7. References The references list the sources used by the author(s) to document what prior research and information was used when conducting the study. After reviewing the article or research paper, use the references to identify additional sources of information on the topic and to examine critically how these sources supported the overall research agenda. Questions to consider when reading the references include:
NOTE: A final strategy in reviewing research is to copy and paste the title of the source [journal article, book, research report] into Google Scholar . If it appears, look for a "cited by" reference followed by a hyperlinked number under the record [e.g., Cited by 45]. This number indicates how many times the study has been subsequently cited in other, more recently published works. This strategy, known as citation tracking, can be an effective means of expanding your review of pertinent literature based on a study you have found useful and how scholars have cited it. The same strategies described above can be applied to reading articles you find in the list of cited by references. Reading TipSpecific Reading Strategies Effectively reading scholarly research is an acquired skill that involves attention to detail and an ability to comprehend complex ideas, data, and theoretical concepts in a way that applies logically to the research problem you are investigating. Here are some specific reading strategies to consider. As You are Reading
Taking notes as you read will save time when you go back to examine your sources. Here are some suggestions:
Write down thoughts that come to mind that may help clarify your understanding of the research problem. Here are some examples of questions to ask yourself:
Adapted from text originally created by Holly Burt, Behavioral Sciences Librarian, USC Libraries, April 2018. Another Reading TipWhen is it Important to Read the Entire Article or Research Paper Laubepin argues, "Very few articles in a field are so important that every word needs to be read carefully." * However, this implies that some studies are worth reading carefully if they directly relate to understanding the research problem. As arduous as it may seem, there are valid reasons for reading a study from beginning to end. Here are some examples:
* Laubepin, Frederique. How to Read (and Understand) a Social Science Journal Article . Inter-University Consortium for Political and Social Research (ISPSR), 2013 Shon, Phillip Chong Ho. How to Read Journal Articles in the Social Sciences: A Very Practical Guide for Students . 2nd edition. Thousand Oaks, CA: Sage, 2015; Lockhart, Tara, and Mary Soliday. "The Critical Place of Reading in Writing Transfer (and Beyond): A Report of Student Experiences." Pedagogy 16 (2016): 23-37; Maguire, Moira, Ann Everitt Reynolds, and Brid Delahunt. "Reading to Be: The Role of Academic Reading in Emergent Academic and Professional Student Identities." Journal of University Teaching and Learning Practice 17 (2020): 5-12.
Information
InitiativesYou are accessing a machine-readable page. In order to be human-readable, please install an RSS reader. All articles published by MDPI are made immediately available worldwide under an open access license. No special permission is required to reuse all or part of the article published by MDPI, including figures and tables. For articles published under an open access Creative Common CC BY license, any part of the article may be reused without permission provided that the original article is clearly cited. For more information, please refer to https://www.mdpi.com/openaccess . Feature papers represent the most advanced research with significant potential for high impact in the field. A Feature Paper should be a substantial original Article that involves several techniques or approaches, provides an outlook for future research directions and describes possible research applications. Feature papers are submitted upon individual invitation or recommendation by the scientific editors and must receive positive feedback from the reviewers. Editor’s Choice articles are based on recommendations by the scientific editors of MDPI journals from around the world. Editors select a small number of articles recently published in the journal that they believe will be particularly interesting to readers, or important in the respective research area. The aim is to provide a snapshot of some of the most exciting work published in the various research areas of the journal. Original Submission Date Received: .
Article Menu
Find support for a specific problem in the support section of our website. Please let us know what you think of our products and services. Visit our dedicated information section to learn more about MDPI. JSmol ViewerContribution to school design through assessment of corridor conditions in foundation schools in erbil, iraq, 1. introduction, 2.1. spatial zoning in school buildings, 2.1.1. corridors as spatial areas, 2.1.2. circulation ratio guidelines, 2.2. considered factors, 2.2.1. usability, 2.2.2. flexibility and adaptability, 2.2.3. cost-effective school design, 2.2.4. sustainable and green building practices, 3. research methodologies, 3.1. study design and methods, 3.2. sample schools, 3.3. data collection tool and procedure, 3.4. statistical methods, 4. results and discussion, 4.1. analysis of revit software, 4.2. questionnaire survey result analysis, 4.2.1. descriptive analysis of the respondents’ opinions, 4.2.2. paired-sample t -test results, gender variable, school corridor design, 4.2.3. one-way anova results, 4.3. development of innovative design concepts, 4.3.1. elimination of traditional corridors, 4.3.2. separate units for different educational stages, 4.3.3. private and common outdoor areas, 4.3.4. flexible partitions, 4.3.5. phased construction, 4.3.6. redesign proposals for l-shaped and o-shaped schools, 5. conclusions, future study, data availability statement, conflicts of interest.
Click here to enlarge figure
Share and CiteZewar, S.S. Contribution to School Design through Assessment of Corridor Conditions in Foundation Schools in Erbil, Iraq. Buildings 2024 , 14 , 2678. https://doi.org/10.3390/buildings14092678 Zewar SS. Contribution to School Design through Assessment of Corridor Conditions in Foundation Schools in Erbil, Iraq. Buildings . 2024; 14(9):2678. https://doi.org/10.3390/buildings14092678 Zewar, Sardar Suwar. 2024. "Contribution to School Design through Assessment of Corridor Conditions in Foundation Schools in Erbil, Iraq" Buildings 14, no. 9: 2678. https://doi.org/10.3390/buildings14092678 Article MetricsArticle access statistics, further information, mdpi initiatives, follow mdpi. Subscribe to receive issue release notifications and newsletters from MDPI journals | |||||||||||||||||||||||||||||||||||||||||||||||||||||||||||||||||||||||||||||||||||||||||||||||||||||||||||||||||||||||||||||||||||||||||||||||||||||||||||||||||||||||||||||||||||||||||||||||||||||||||||||||||||||||||||||||||||||||||||||||||||||||||||||||||||||||||||||||||||||||||||||||||||||||||||||||||||||||||||||||||||||||||||||||||||||||||||||||||||||||||||||||||||||||||||||||||||||||||||||||||||||||||||||||||||||||||||||||||||||||||||||||||||||||||||||||||||||||||||||||||||||||||||||||||||||||||||||||||||||||||||||||||||||||||||||||||||||||||||||||||||||||||||||||||||||||||||||||||||||||||||||||||||||||||||||||||||||||||||||||||||||||||||||||||||||||||||||||||||||||||||||||||||||||||||||||||||||||||||||||||||||||||||||||||||||||||||||||||||||||||||||||||||||||||||||||||||||||||||||||||||||||||||||||||||||||||||||||||||||||||||||||||||||||||||||||||||||||||||||||||||||||||||||||||||||||||||||||||||||||||||||||||||||||||||||||||||||||||||||||||||||||||||||||||||||||||||||||||||||||
COMMENTS
The main heading of "Methods" should be centered, boldfaced, and capitalized. Subheadings within this section are left-aligned, boldfaced, and in title case. You can also add lower level headings within these subsections, as long as they follow APA heading styles. To structure your methods section, you can use the subheadings of ...
The methods section of a quantitative study should describe how each objective of your study will be achieved. Be sure to provide enough detail to enable the reader can make an informed assessment of the methods being used to obtain results associated with the research problem. The methods section should be presented in the past tense.
Methods section is a crucial part of a manuscript and emphasizes the reliability and validity of a research study. And knowing how to write the methods section of a research paper is the first step in mastering scientific writing. Read this article to understand the importance, purpose, and the best way to write the methods section of a research paper.
The methods section should describe what was done to answer the research question, describe how it was done, justify the experimental design, and explain how the results were analyzed. Scientific writing is direct and orderly. Therefore, the methods section structure should: describe the materials used in the study, explain how the materials ...
"How to Write the Methods Section of a Research Paper." Respiratory Care 49 (October 2004):1229-1232; Lunenburg, Frederick C. Writing a Successful Thesis or Dissertation: Tips and Strategies for Students in the Social and Behavioral Sciences. Thousand Oaks, CA: Corwin Press, 2008. Methods Section. The Writer's Handbook. Writing Center.
Your Methods Section contextualizes the results of your study, giving editors, reviewers and readers alike the information they need to understand and interpret your work. Your methods are key to establishing the credibility of your study, along with your data and the results themselves. A complete methods section should provide enough detail ...
The methodology section of your paper describes how your research was conducted. This information allows readers to check whether your approach is accurate and dependable. A good methodology can help increase the reader's trust in your findings. First, we will define and differentiate quantitative and qualitative research.
1. Focus on your objectives and research questions. The methodology section should clearly show why your methods suit your objectives and convince the reader that you chose the best possible approach to answering your problem statement and research questions. 2.
Do yourself a favour and start with the end in mind. Section 1 - Introduction. As with all chapters in your dissertation or thesis, the methodology chapter should have a brief introduction. In this section, you should remind your readers what the focus of your study is, especially the research aims. As we've discussed many times on the blog ...
The methodology section of a research paper outlines how you plan to conduct your study. It covers various steps such as collecting data, statistical analysis, observing participants, and other procedures involved in the research process. The methods section should give a description of the process that will convert your idea into a study.
Learn how to write a strong methodology chapter that allows readers to evaluate the reliability and validity of the research. A good methodology chapter incl...
In the methods section, researchers clearly describe the methods they used to obtain and analyze the data for their research. When relying on data collected specifically for a given paper, researchers will need to discuss the sample and data collection; in most cases, though, quantitative research relies on pre-existing datasets.
2. Structure the section so that it tells the story of your research: All the experiments should be presented in a logical manner that helps the reader retrace the gradual and development and nuances of the study. A useful way of achieving this is to describe the methods in a chronological order of the experiments.
Summarizing quantitative data and its effective presentation and discussion can be challenging for students and researchers. This chapter provides a framework for adequately reporting findings from quantitative analysis in a research study for those contemplating to write a research paper. The rationale underpinning the reporting methods to ...
Method Introduction: Begin the section on methodology by introducing the methods used in the research. Provide a brief overview of the research design and the data collection and analysis techniques used. Methodological Connection: Establish the connection between the methodology and the research query.
The Method Chapter Describing Your Research Plan T he Method chapter of a dissertation, article, or proposal describes the exact steps that will be undertaken to address your hypotheses or research questions. For this reason, the Method section follows logically from the statement of the problem in much the same way as research
How to Write Research Methodology. Writing a research methodology involves explaining the methods and techniques you used to conduct research, collect data, and analyze results. It's an essential section of any research paper or thesis, as it helps readers understand the validity and reliability of your findings. Here are the steps to write a ...
Writing* / standards. The methods section of a research paper provides the information by which a study's validity is judged. Therefore, it requires a clear and precise description of how an experiment was done, and the rationale for why specific experimental procedures were chosen. The methods section should describe wh ….
The answer is written in length in the discussion section of the paper. Thus, the research question gives a preview of the different parts and variables of the study meant to address the problem posed in the research question.1 An excellent research question clarifies the research writing while facilitating understanding of the research topic ...
In this brief lecture, we'll describe the components of a 'Research Methods' section in a paper, including the procedures for collecting and analyzing data i...
The results section of a quantitative research paper is where you summarize your data and ... she enjoys writing articles explaining tricky research concepts for students and academics. Other students also liked. How to write an APA methods section In the methods section of an APA research paper, you report in detail the participants, measures ...
Abstract. The methods section of a research paper provides the information by which a study's validity is judged. Therefore, it requires a clear and precise description of how an experiment was ...
Describe the steps of the scientific method. Specify how variables are defined. Compare and contrast the major research designs. Explain how to judge the quality of a source for a literature review. Compare and contrast the kinds of research questions scientists ask. Explain what it means for an observation to be reliable.
The methods section should explain how subjects were identified and should state inclusion and exclusion criteria. All materials used to complete the study should be described in detail, including equipment, drugs, gases, chemicals, treatments, interventions, or other items. Study procedures should outline all steps taken to obtain the results ...
Below are recommendations on how to read each section of a research paper effectively. Note that the sections to read are out of order from how you will find them organized in a journal article or research paper. 1. Abstract. The abstract summarizes the background, methods, results, discussion, and conclusions of a scholarly article or research ...
Statistics document from University Of Arizona, 2 pages, The results Section Example Reporting Results The results section of a paper is a complete report of your findings Usually goes for quantitative studies: o Demographic information (i.e. Descriptive analysis) o Information on variables of interest o Infe
Thus, we employed a mixed-method research approach, combining qualitative and quantitative data collection methods. The research began with an in-depth literature review of relevant topics and studies to understand relevant issues, identify any gaps in the knowledge, and develop concepts for the study design.