A Guide to User Research Analysis

When designers perform user interviews, field observations, or usability tests, they gather tons of notes and data to help inform design decisions and recommendations. But how do they make sense of so much qualitative data? Talking to customers is great, but most people walk away feeling overwhelmed by the sense of more information than they know what to do with. Learning how to properly analyze UX research helps turn raw data into insights and action.

What Is User Research Analysis?
User research analysis is a vital part of any research process because it is the very act of making sense of what was learned so that informed recommendations can be made on behalf of customers or users.
As researchers conduct analysis, they’re spending time categorizing, classifying, and organizing the data they’ve gathered to directly inform what they’ll share as outcomes of the research and the key findings.
Why Should Researchers Spend Time on Analysis?
Our natural instinct is to believe we can remember everything we heard or saw in an interview. But following impulsive decisions made from raw notes and data can be misleading and dangerous. Recommendations based on a single data point can lead a team down the path of solving the wrong problem.
Further, doing so is simply reacting to data, not making sense of it. This can cause companies to focus on incremental improvements only and miss important opportunities to serve customers in more meaningful, innovative ways.
A great example of this is when we see teams sharing research findings like, “6 out of 10 people had difficulty signing in to our application.” On the surface, a reasonable recommendation could be to redesign the sign-in form. However, proper research analysis and finding the meaning behind what that data represents is when the real magic happens. Perhaps the reason people had trouble signing in was due to forgotten passwords. In this case, redesigning the sign in form wouldn’t necessarily solve this problem.
Performing the necessary analysis of user research data is an act of asking “why” the “6 out of 10 people had difficulty signing into the application.” Analysis transforms the research from raw data into insights and meaning.
Consider what Slack did with their sign-in process. Slack allows a user to sign in by manually typing their password or having a “magic link” sent to their email which the person simply needs to click from their inbox. They get signed in to their Slack team and get started.

Slack offers a magic link instead of asking users to type their password.

Slack emails a magic link within seconds that saves the user typing their password.
This decision wasn’t an accident; it came from a deep understanding of a customer pain point. That deep understanding came from making sense of user research data and not simply jumping to a conclusion. Slack’s example demonstrates the power of spending time in analyzing user research data to go beyond reacting to a single observation and instead understanding why those observations occurred.
When to Do Research Analysis
Before the research begins.
Great analysis starts before research even begins. This happens by creating well-defined goals for the project, research, and product. Creating clear goals allows researchers to collect data in predefined themes to answer questions about how to meet those goals. This also allows them to create a set of tags (sometimes known as “codes”) to assign to notes and data as they conduct their research, speeding up analysis dramatically.
Before any research session begins, craft clear goals and questions that need to be answered by the research. Then brainstorm a list of tags or descriptors for each goal that will help identify notes and data that align to the goals of the research.
During the Research
Researchers often tag or code data they gather in real time. This can be done multiple ways using spreadsheets, document highlighting or even a specialized research tool like Aurelius.
When taking notes in a spreadsheet, tags can be added to individual notes in an adjacent column and later turned into a “ rainbow spreadsheet .”
For teams physically located in the same space, an affinity diagram with sticky notes on the wall works well. Here, each note can be added to an individual sticky note with top level tags or themes grouped physically together.

A student stands in front of an affinity exercise on a whiteboard. Photo via Wikimedia
There are also software tools like Aurelius that help researchers tag and organize notes as they’re taken which also makes for quick viewing and analysis of those tags later.

View of analyzing notes and tags in Aurelius.
It’s also useful for teams to have a short debrief after each research participant or session to discuss what they learned. This keeps knowledge fresh, allows the team members to summarize what they’ve learned up to that point, and often exposes new themes or tags to use in collecting data from the remaining research sessions.
When the Research Is Done
This is where most of the analysis happens. At this point researchers are reviewing all the notes they’ve taken to really figure out what patterns and insights exist. Most researchers will have a good idea of which tags, groups, and themes to focus on, especially if they’ve done a debrief after each session. It then becomes a matter of determining why those patterns and themes exist in order to create new knowledge and insight about their customers.
How to Analyze User Research
Tag notes and data as you collect it.
Tagging notes and data as they’re collected is a process of connecting those tags to research questions and the research questions back to the project or research goals. This way you can be confident in the tags and themes being created in real time. Here’s how to make the connection between tags, research questions and project goals.
Imagine the research goals for the project are:
- Increase the number of people signing up for our product free trial
- Increase the number of people going from free trial to a paid account
- Educate trial customers about the value of our product prior to signing up for a paid account
From there, research questions can be formed such as:
- “Does the website communicate the right message to share the value of a free trial?”
- “Is it easy for a new customer to sign up?”
- “Are new customers easily able to start a free trial and begin using the product?”
From those questions, we can extract topics and themes. Since we’re researching the free trial, sign up process and general usability of that process, they become clear choices for tags. Also, since the research is meant to answer a question about whether or not potential customers understand the value of our product and free trial, this too provides a clear topic and tag we can use. So, useful tags based on those questions would be:
- #free-trial
- #value-prop
- #signup-reason
- #signup-process
- #onboarding
As the team conducts the research, they can tag notes and observations according to those themes that align to the high level goals and questions for the project. All of this highly increases the ease and effectiveness of research analysis later.
Analysis After Each Session
A common user research practice is for the team to debrief after each interview, usability test, or field study to discuss what was learned or observed. Doing this while also reviewing the notes and observations helps researchers hear the same information from a new perspective.
Let’s imagine the team found the following patterns while conducting their research:
- Potential customers visited the product page, free trial sign-up page, and went back to the product page several times prior to starting a free trial.
- Some people had multiple browsers open with competitor sites pulled up while signing up for the free trial.
- Potential customers mentioned waiting for the “right time” to start their free trial on several occasions.
This may help the researchers create new tags (or codes) for remaining sessions, such as:
- #right-time
- #competitor-review
- #feature-comparison
Using these new tags adds another dimension to analysis and provides deeper meaning to patterns the team is finding. You can see how the combination of these tags and themes already begin to paint a picture of customer needs without any detailed notes!
Here are some good tips for knowing when to tag or code a note:
- It aligns directly to a project/research goal.
- The participant specifically said or implied that something is very important.
- Repetition – a thing is said or heard multiple times.
- Patterns – when certain observations are related or important to other tags and themes already established in the project goals or research.
Steps for Analyzing Research Once It’s Done
Once all the research is done, it’s time to dig in to find patterns and frequency across all the data gathered .
Step 1 – Review the notes, transcripts, and data for any relevant phrases, statements, and concepts that align to the research goals and questions.
Step 2 – Tag and code any remaining data that represents key activities, actions, concepts, statements, ideas and needs or desires from the customers who participated in the research.
Step 3 – Review those tags and codes to find relationships between them. A useful tip for this is to pay close attention to tags that have notes with multiple other tags. This often indicates a relationship between themes. Create new tags and groups where appropriate to review more specific subsets of the data. Continue this process until meaningful themes are exposed. Once that happens, ask questions like:
- Why do these patterns or themes exist?
- Why did participants say this so many times?
- Does the data help answer the research questions?
- Does the data inform ways to meet the research goals?
- Does one tag group or theme relate to another? How? Why?
Sharing Key Insights from User Research
A key insight should answer one or more of your research questions and directly inform how to meet one or more of the established business goals. When sharing key insights, be sure to make a clear connection between one of the business goals, research questions and why the key insight is relevant to both. The most effective way of turning research into action is by helping teams make a connection between key insights and business outcomes.
3 Parts to a Key Insight
There are three parts to creating a key insight from user research :
- Statement of what you learned
- Tags that describe the insight (often used from the analysis, but can also be new tags entirely)
- Supporting notes, data, and evidence that give further context to the key insight and support the statement of what was learned
A key insight from the example project might be:
“Prospective customers are worried they might not have enough time to review our product during the free trial.” #right-time #signup-process #free-trial
This represents the pattern observed of customers mentioning the “right time” to sign up for a free trial and comparing the product to competitors. It also goes beyond sharing the quantitative data that those things occurred and offers a qualitative explanation of why they happened. All of this leads to clearer recommendations and the ability for other teams to take action on the research findings.
Creating key insights from the research in this way allows for the most effective sharing and reuse later. By providing supporting notes to each insight, stakeholders and others consuming the research findings can learn more detail about each key insight if they so choose.
Next Steps for User Research Analysis
Conducting detailed analysis of user research data helps teams clearly share what was learned to provide more actionable recommendations in design and product development.
Here are some tips for making user research analysis faster and easier on upcoming projects:
- Begin the user research by creating well defined questions and goals.
- Create tags based on each goal.
- Tag research notes and data as it’s collected to speed up analysis later.
- Debrief after each research session.
- Review the data once research is finished to find patterns, frequency, and themes.
- Make statements about each pattern or theme that was uncovered, describing what it means and why it’s important (aka: create key insights).
- Share the key insights!
UX Booth is trusted by over 100,000 user experience professionals. Start your subscription today for free.
More in Analytics
Related articles.
- An Analytics-First Approach to UX, Part 1
- Putting Big Data in Context
- 4 Quick Tips for Getting the Most out of Google Analytics
Super Guide
- User Research Designers
- UX Researchers
- Digital Designers
- UX Designers
- UX Strategists
- Product Designers
- UI Designers
- Mobile App Designers
The Complete Guide to UX Research Methods
UX research provides invaluable insight into product users and what they need and value. Not only will research reduce the risk of a miscalculated guess, it will uncover new opportunities for innovation.

By Miklos Philips
Miklos is a UX designer, product design strategist, author, and speaker with more than 18 years of experience in the design field.
PREVIOUSLY AT
“Empathy is at the heart of design. Without the understanding of what others see, feel, and experience, design is a pointless task.” —Tim Brown, CEO of the innovation and design firm IDEO
User experience (UX) design is the process of designing products that are useful, easy to use, and a pleasure to engage. It’s about enhancing the entire experience people have while interacting with a product and making sure they find value, satisfaction, and delight. If a mountain peak represents that goal, employing various types of UX research is the path UX designers use to get to the top of the mountain.
User experience research is one of the most misunderstood yet critical steps in UX design. Sometimes treated as an afterthought or an unaffordable luxury, UX research, and user testing should inform every design decision.
Every product, service, or user interface designers create in the safety and comfort of their workplaces has to survive and prosper in the real world. Countless people will engage our creations in an unpredictable environment over which designers have no control. UX research is the key to grounding ideas in reality and improving the odds of success, but research can be a scary word. It may sound like money we don’t have, time we can’t spare, and expertise we have to seek.
In order to do UX research effectively—to get a clear picture of what users think and why they do what they do—e.g., to “walk a mile in the user’s shoes” as a favorite UX maxim goes, it is essential that user experience designers and product teams conduct user research often and regularly. Contingent upon time, resources, and budget, the deeper they can dive the better.

What Is UX Research?
There is a long, comprehensive list of UX design research methods employed by user researchers , but at its center is the user and how they think and behave —their needs and motivations. Typically, UX research does this through observation techniques, task analysis, and other feedback methodologies.
There are two main types of user research: quantitative (statistics: can be calculated and computed; focuses on numbers and mathematical calculations) and qualitative (insights: concerned with descriptions, which can be observed but cannot be computed).
Quantitative research is primarily exploratory research and is used to quantify the problem by way of generating numerical data or data that can be transformed into usable statistics. Some common data collection methods include various forms of surveys – online surveys , paper surveys , mobile surveys and kiosk surveys , longitudinal studies, website interceptors, online polls, and systematic observations.
This user research method may also include analytics, such as Google Analytics .
Google Analytics is part of a suite of interconnected tools that help interpret data on your site’s visitors including Data Studio , a powerful data-visualization tool, and Google Optimize, for running and analyzing dynamic A/B testing.
Quantitative data from analytics platforms should ideally be balanced with qualitative insights gathered from other UX testing methods , such as focus groups or usability testing. The analytical data will show patterns that may be useful for deciding what assumptions to test further.
Qualitative user research is a direct assessment of behavior based on observation. It’s about understanding people’s beliefs and practices on their terms. It can involve several different methods including contextual observation, ethnographic studies, interviews, field studies, and moderated usability tests.

Jakob Nielsen of the Nielsen Norman Group feels that in the case of UX research, it is better to emphasize insights (qualitative research) and that although quant has some advantages, qualitative research breaks down complicated information so it’s easy to understand, and overall delivers better results more cost effectively—in other words, it is much cheaper to find and fix problems during the design phase before you start to build. Often the most important information is not quantifiable, and he goes on to suggest that “quantitative studies are often too narrow to be useful and are sometimes directly misleading.”
Not everything that can be counted counts, and not everything that counts can be counted. William Bruce Cameron
Design research is not typical of traditional science with ethnography being its closest equivalent—effective usability is contextual and depends on a broad understanding of human behavior if it is going to work.
Nevertheless, the types of user research you can or should perform will depend on the type of site, system or app you are developing, your timeline, and your environment.

Top UX Research Methods and When to Use Them
Here are some examples of the types of user research performed at each phase of a project.
Card Sorting : Allows users to group and sort a site’s information into a logical structure that will typically drive navigation and the site’s information architecture. This helps ensure that the site structure matches the way users think.
Contextual Interviews : Enables the observation of users in their natural environment, giving you a better understanding of the way users work.
First Click Testing : A testing method focused on navigation, which can be performed on a functioning website, a prototype, or a wireframe.
Focus Groups : Moderated discussion with a group of users, allowing insight into user attitudes, ideas, and desires.
Heuristic Evaluation/Expert Review : A group of usability experts evaluating a website against a list of established guidelines .
Interviews : One-on-one discussions with users show how a particular user works. They enable you to get detailed information about a user’s attitudes, desires, and experiences.
Parallel Design : A design methodology that involves several designers pursuing the same effort simultaneously but independently, with the intention to combine the best aspects of each for the ultimate solution.
Personas : The creation of a representative user based on available data and user interviews. Though the personal details of the persona may be fictional, the information used to create the user type is not.
Prototyping : Allows the design team to explore ideas before implementing them by creating a mock-up of the site. A prototype can range from a paper mock-up to interactive HTML pages.
Surveys : A series of questions asked to multiple users of your website that help you learn about the people who visit your site.
System Usability Scale (SUS) : SUS is a technology-independent ten-item scale for subjective evaluation of the usability.
Task Analysis : Involves learning about user goals, including what users want to do on your website, and helps you understand the tasks that users will perform on your site.
Usability Testing : Identifies user frustrations and problems with a site through one-on-one sessions where a “real-life” user performs tasks on the site being studied.
Use Cases : Provide a description of how users use a particular feature of your website. They provide a detailed look at how users interact with the site, including the steps users take to accomplish each task.

You can do user research at all stages or whatever stage you are in currently. However, the Nielsen Norman Group advises that most of it be done during the earlier phases when it will have the biggest impact. They also suggest it’s a good idea to save some of your budget for additional research that may become necessary (or helpful) later in the project.
Here is a diagram listing recommended options that can be done as a project moves through the design stages. The process will vary, and may only include a few things on the list during each phase. The most frequently used methods are shown in bold.

Reasons for Doing UX Research
Here are three great reasons for doing user research :
To create a product that is truly relevant to users
- If you don’t have a clear understanding of your users and their mental models, you have no way of knowing whether your design will be relevant. A design that is not relevant to its target audience will never be a success.
To create a product that is easy and pleasurable to use
- A favorite quote from Steve Jobs: “ If the user is having a problem, it’s our problem .” If your user experience is not optimal, chances are that people will move on to another product.
To have the return on investment (ROI) of user experience design validated and be able to show:
- An improvement in performance and credibility
- Increased exposure and sales—growth in customer base
- A reduced burden on resources—more efficient work processes
Aside from the reasons mentioned above, doing user research gives insight into which features to prioritize, and in general, helps develop clarity around a project.

What Results Can I Expect from UX Research?
In the words of Mike Kuniaysky, user research is “ the process of understanding the impact of design on an audience. ”
User research has been essential to the success of behemoths like USAA and Amazon ; Joe Gebbia, CEO of Airbnb is an enthusiastic proponent, testifying that its implementation helped turn things around for the company when it was floundering as an early startup.
Some of the results generated through UX research confirm that improving the usability of a site or app will:
- Increase conversion rates
- Increase sign-ups
- Increase NPS (net promoter score)
- Increase customer satisfaction
- Increase purchase rates
- Boost loyalty to the brand
- Reduce customer service calls
Additionally, and aside from benefiting the overall user experience, the integration of UX research into the development process can:
- Minimize development time
- Reduce production costs
- Uncover valuable insights about your audience
- Give an in-depth view into users’ mental models, pain points, and goals
User research is at the core of every exceptional user experience. As the name suggests, UX is subjective—the experience that a person goes through while using a product. Therefore, it is necessary to understand the needs and goals of potential users, the context, and their tasks which are unique for each product. By selecting appropriate UX research methods and applying them rigorously, designers can shape a product’s design and can come up with products that serve both customers and businesses more effectively.
Further Reading on the Toptal Blog:
- How to Conduct Effective UX Research: A Guide
- The Value of User Research
- UX Research Methods and the Path to User Empathy
- Design Talks: Research in Action with UX Researcher Caitria O'Neill
- Swipe Right: 3 Ways to Boost Safety in Dating App Design
- How to Avoid 5 Types of Cognitive Bias in User Research
Understanding the basics
How do you do user research in ux.
UX research includes two main types: quantitative (statistical data) and qualitative (insights that can be observed but not computed), done through observation techniques, task analysis, and other feedback methodologies. The UX research methods used depend on the type of site, system, or app being developed.
What are UX methods?
There is a long list of methods employed by user research, but at its center is the user and how they think, behave—their needs and motivations. Typically, UX research does this through observation techniques, task analysis, and other UX methodologies.
What is the best research methodology for user experience design?
The type of UX methodology depends on the type of site, system or app being developed, its timeline, and environment. There are 2 main types: quantitative (statistics) and qualitative (insights).
What does a UX researcher do?
A user researcher removes the need for false assumptions and guesswork by using observation techniques, task analysis, and other feedback methodologies to understand a user’s motivation, behavior, and needs.
Why is UX research important?
UX research will help create a product that is relevant to users and is easy and pleasurable to use while boosting a product’s ROI. Aside from these reasons, user research gives insight into which features to prioritize, and in general, helps develop clarity around a project.
- UserResearch
Miklos Philips
London, United Kingdom
Member since May 20, 2016
About the author
World-class articles, delivered weekly.
By entering your email, you are agreeing to our privacy policy .
Toptal Designers
- Adobe Creative Suite Experts
- Agile Designers
- AI Designers
- Art Direction Experts
- Augmented Reality Designers
- Axure Experts
- Brand Designers
- Creative Directors
- Dashboard Designers
- Digital Product Designers
- E-commerce Website Designers
- Full-Stack Designers
- Information Architecture Experts
- Interactive Designers
- Mockup Designers
- Presentation Designers
- Prototype Designers
- SaaS Designers
- Sketch Experts
- Squarespace Designers
- User Flow Designers
- Virtual Reality Designers
- Visual Designers
- Wireframing Experts
- View More Freelance Designers
Join the Toptal ® community.

- ALL BLOG POSTS /
20 Essential UX research methods and how they help you build better products
The product development process has many aspects to take care of with decisions that can lead to success or disappointment. Finding the right path might seem tricky, but UX research methods become invaluable insights, which we’ll talk about today.

When every business is battling for attention, the importance of understanding your customers cannot be overstated. User experience (UX) research stands at the forefront, providing valuable data about user behaviors, preferences, and pain points, which is essential for tailoring products that truly resonate with and captivate your audience. In this article, we’ll figure out what exactly UX research is and, as a bonus, provide the 20 essential techniques shaping the world of user-centric product design in 2023.
What is UX research?
UX research is all about understanding the people who will use your product. It’s a way to discover what they need, what they like, and how they behave. There are different methods to do this, like asking questions, analyzing how customers interact with a product, or studying data about their behavior. By doing UX research, you can avoid guessing what users want and instead give them something they will really like and find helpful.
UX research? It’s like chatting with your users to get what they want — no guesswork needed!
Why UX research is important for your product creation
You can’t create a product “just because you want to.” Well, in fact, you can, but will it be useful? Understanding why UX research is crucial in developing a product is the first step toward building something truly remarkable. There are a number of advantages you should consider, so let’s discuss them in detail.
- User satisfaction. First off, UX research puts you in your users’ shoes. It’s the best way to uncover what they need, what frustrates them, and what makes them happy. When you understand these pain points and desires, you can create solutions that potential customers will love.
- Reduced development cost. Investing in UX analysis might seem like an extra expense, but it actually saves you money down the line. While making changes after a product launch is expensive and time-consuming, UX research helps you get it right the first time.
- Product usability. Usability is essential to any successful product, and this is where UX research shines. With proper analysis and focus on usability, you can enhance user satisfaction, making the website or app more appealing and encouraging for repeat usage.
- Increase conversion rates. It’s pretty straightforward — when you understand what users need and how they interact with the product, you can make improvements that hit the mark. These tweaks can make their experience smoother, encouraging more people to leap from being interested to making a purchase.
- Competitive advantage. Every business aims to gain a competitive edge, and UX research is exactly what you need for it. By understanding users and what they need, you can make your product stand out from the crowd. This isn’t just about being different — it’s about being better in a way that matters to your users.
- Informed decision-making. UX research can significantly help when it comes to making decisions in the process of product creation. It gives real, user-based insights, so you’re not just guessing what might work but making informed choices based on what users want and need.
- Brand loyalty. When users feel that a product is made with their needs in mind, they’re more likely to stick around. This loyalty stems from a sense of being understood and valued, a crucial outcome of effective UX research. In short, good UX leads to satisfied users, who, in turn, become loyal supporters of your brand.
With all of these benefits, it’s clear that starting with UX research, you’re starting on the path to success. It bridges the gap between user needs and business goals, leading to effective, efficient, and emotionally engaging solutions.

Types of user research
There are various types of UX research, each with its goals and objectives. From unique insights to different aspects of gathering information, every method helps to craft products that truly resonate with your audience. Overall, there are six main types of user research, which we’re going to discuss below.
Attitudinal vs. behavioral
When we talk about user research, we primarily look at two types: attitudinal and behavioral. The attitudinal type focuses on what users say. It’s all about understanding their attitudes, preferences, and opinions by using tools like surveys, interviews, and questionnaires. Think of it as having a direct conversation with your users to learn how they feel about your product or what they wish for.
In contrast, behavioral research is based on what users actually do. It involves being an observer, watching how people interact with your product. In that case, you can use such methods as usability testing, session recordings, and heatmaps to get the necessary data. This approach is crucial for understanding the true user experience and pinpointing areas for improvement.
Together, these two research methods give a comprehensive view of the customers, blending what they tell with what their actions show.
Qualitative vs. quantitative
Alright, let’s talk about more types of user research: qualitative and quantitative. They both play crucial roles in crafting a complete picture of customer engagement and preferences.
Qualitative research gathers stories about users’ experiences, thoughts, and feelings regarding your product. hrough interviews, focus groups, and direct observations, you gain insights into the “why” and “how” people behave while interacting with a website or app.
Now, let’s switch to quantitative research. This one deals with the hard data and is full of numbers. To get exact answers about what is happening on the website, use tools like surveys with fixed responses, website analytics, and statistical analysis. How many people clicked here? What percentage completed their purchase? Quantitative research gives you these facts and, most importantly, stats.
Qualitative research is about the quality of data — the stories and experiences, while quantitative focuses on the numbers.
Generative vs. evaluative
Among the various user research methods, it’s worth discussing generative and evaluative approaches. Both of them are super important to get a well-rounded understanding of your users and, as a result, create a successful product based on these insights.
Generative research is the go-to at the beginning stages of product development or when brainstorming for innovative solutions. It is all about coming up with new ideas and understanding broader user needs and behaviors through interviews, field studies, and diary studies. This type of research outlines what users need and want, helping to figure out what products or features to develop.
Following generative research, as your product ideas take shape, shift to evaluative research. This phase is crucial for assessing what you’ve created. It’s focused on refinement and improvement, using tools like usability testing, A/B testing, and specific surveys. The goal is to test your products against real user expectations and experiences, ensuring that the crafted product resonates with them and effectively meets their needs.

Top 20 UX design research methods and when to use them
Understanding users is the basis of impactful design, and the right research methods are key to gaining this insight. Scroll further as we explore 20 essential UX research techniques, each with its specific application context.

1. Surveys
In UX research, surveys are handy for getting user feedback and can be qualitative or quantitative, depending on the type of questions asked. Qualitative surveys include open-ended questions to gain insights into what users think and feel, while quantitative use closed-ended questions (like multiple choice or ratings) to get data that’s easy to measure. There are two ways to conduct surveys, namely:
- Email surveys. Sent directly to users’ inboxes, these surveys help reach a broad audience by asking specific things about your product or service. To recruit participants for email surveys, utilize your existing customer database or sign-up forms on your website.
- On-site surveys. They pop up while users browse the website or app, letting you grab feedback about their experience right then and there. For on-site surveys, you can target customers who are actively engaging with your site.
Surveys are versatile. You can use them at various stages of the product development process — from the initial conceptualization phase to after the launch. They help collect data from many users, spot trends in user behavior, and gather thoughts on specific features.
2. Interviews
A key qualitative method in UX research is interviews, where a researcher meets one-on-one with users to discuss a particular topic. This method includes two main types: in-depth interviews (IDIs) and intercept interviews.
- In-depth interviews (IDIs). They’re usually conducted in a relaxed and cozy environment where participants can talk through everything in detail. If you want to find people for IDIs who match your user profile, surf online, through social media, or use your customer list.
- Intercept interviews. They happen right where the action is — on a website, wherever users interact with your product or service. You’ll approach visitors while they’re using the website or just after they’ve used it. It’s free-flowing, so you rely on their willingness to chat there and then.
This UX method fits perfectly at different stages of your project development, from concept to release. In the early phases, it acts as a tool for gathering the target audience and shaping the user base. Towards the end, this approach becomes a great possibility for getting the lowdown on how people find your product’s usability and appeal.
3. Personas
Think of personas as characters in a story, but in this case, they are based on real users. This qualitative method helps you make design decisions in the early stages of product development based on what people need and expect. It means ensuring your website or product is a hit with your audience, not just an imaginary user.
But how do you start creating these personas? First, you need actual user data, which you can gather from online platforms, social media, or customer lists. This process isn’t about guessing who your users are but understanding them through in-depth interviews or observational studies. The great decision is to prepare a set of questions or scenarios to gain insights into people’s lifestyles, preferences, and challenges to paint a comprehensive picture of your user base. This way, every design decision you make is grounded in reality, not assumptions.
4. Usability testing
You’ve got your product or service, and now it’s time to see it in action with people through usability testing. During this process, real users tackle tasks by interacting with your product while a researcher observes their experience, gathering insights on how they use it and where improvements might be needed.
Whether you are wondering when to conduct usability testing, here are some tips to help you make an informed decision:
- Before the design stage. Such an early insight can influence the direction of your design, ensuring it meets the user requirements from the start.
- After wireframe or prototype creation. It helps identify usability issues early on, saving time and resources by preventing costly redesigns later.
- Ahead of the product launch. This step is crucial to eliminate last-minute issues and boost user confidence in your product’s reliability.
- Regularly after roll-out. Ongoing testing helps identify areas for improvement and ensures the product remains relevant and user-friendly.
This method can be both qualitative and quantitative. On the qualitative side, you’re watching and listening to participants, getting their thoughts and feelings on the experience. Quantitatively, you measure how long it takes to complete tasks or count errors. Finding the participants for usability testing can be done through online ads, social media, customer databases, or recruitment agencies.
5. Field studies
Another aspect of UX research is field studies, where the action happens in places users typically hang out, like their homes or offices. Social media, customer lists, or special outreach programs are your go-to tools for finding people, but remember, you’re asking to step into their space, and it’s crucial they’re comfortable with that.
This qualitative approach offers a reliable overview of your products during the discovery stage or a ready-made prototype to see whether it fits into customers’ daily lives. Researchers are there to watch and learn — how people interact with the product, what’s happening around them, and all that jazz.
Field studies are about making sure your designs don’t just work in theory but really click in the everyday lives of your users.
6. Focus groups
A classic tool in UX research is focus groups that bring together a small number of people (typically around 6 to 10 participants) to discuss and share their thoughts about your product or service. It’s kind of a hangout, but instead of casual chit-chat, you’re talking about what they think and feel using your creation.
You need a diverse mix of participants representing different facets of your target audience. To find them, try advertising, searching customer databases, or reaching out to communities relevant to your product.
This qualitative method is thoughtful research of people’s opinions, attitudes, and experiences while formulating your website or service concept. The cool thing is, when customers start talking and bouncing ideas off each other, you get to uncover insights that might not pop up in a one-on-one chat.
7. Eye-tracking
Eye-tracking is one of the more fascinating and technological UX research methods used to analyze how users view a website or app. Special equipment follows the movement of a visitor’s eyes, showing what catches their attention, for how long, and in what order. Since eye-tracking is a bit more high-tech, you can search for participants through online platforms, social media, or customer databases.
It is a quantitative process that gives you hard data — numbers and patterns demonstrating where people’s attention goes on the screen. This info is super valuable in the mid to late stages of product development to understand what draws users in and what might be getting overlooked.
8. Remote moderated testing
For remote moderated testing, you can reach out to people through social media, email, or online ads, as this method permits people to join from anywhere. Whether at home, in a cafe, or any comfortable place, this handy UX research technique allows everyone to chill in their favorite spot using video calls and screen-sharing software for testing.
Remote moderated testing can provide qualitative insights by observing and talking to users as they navigate your product in different stages of development. At the same time, you can collect quantitative data like task completion times or error rates. This combo gives you a well-rounded view of the user experience to make iterative improvements based on what real users do and say.
9. Concept testing
Take a glimpse into how potential users might react to a new idea or design before you start the development phase with the concept testing. It involves presenting a concept — like a product idea, feature, or design element — to users and getting their feedback.
Concept testing can swing both ways — qualitative and quantitative. You can gather feedback by engaging users through social media or online communities to share their thoughts and feelings about the website idea. Hard data comes into play when you ask specific questions that can be measured, like rating scales or choice preferences.
10. Diary studies
In the method of diary studies, you make participants keep a record — like a diary — of their experiences with your finished product over a period of time. They jot down their thoughts, feelings, and actions, providing a window into daily interactions with what you’ve created.
Diary studies are mainly qualitative and focused on customers’ personal and detailed experiences. You can reach out to users who are already engaged with your product or use a database, social media platforms, or community forums. By analyzing their information, you get rich, narrative insights into how people navigate and feel about your product in their everyday lives.
11. Customer feedback
You can have a direct line to your users’ thoughts and experiences through customer feedback. That looks like a casual chat with your audience to find out what they love, what frustrates them, and what could be better about your product or service. This communication can be built through a prominent button on your website, a form in your app, or even follow-up emails after a purchase or service use.
Qualitative customer feedback comes from open-ended questions where users share their thoughts in their own words about any stage of your product’s lifecycle. On the other hand, quantitative data is derived from closed-ended questions, such as ratings or multiple-choice queries, offering measurable insights.
12. Desirability studies
With desirability studies, you focus on the visual appeal and emotional impact of your product’s design. In these tests, you show participants different style options for your product and ask them to match these ideas with specific feelings or attributes from a list. It’s a bit like a game, where your design elements correspond to feelings like “exciting,” “modern,” or “user-friendly.”
Desirability studies are primarily quantitative and rely on structured feedback, where participants, who you can find through social media, online ads, or user groups, choose from a ready-made list of attributes. This approach provides measurable data about how users perceive the visual aspects of your product, revealing critical insights into their preferences, design effectiveness, and potential areas for visual enhancement.
13. Card sorting
When it comes to designing the layout and structuring content, card sorting — a user-friendly and insightful method in UX research — kicks in. The main idea is to give participants a set of cards, each labeled with a piece of content or a feature, and ask them to sort it into categories that make sense.
Qualitatively, this method helps you understand how users think and why they group things a certain way. Quantitatively, when you analyze the patterns in how different people sort the cards, you get measurable data on common groupings and preferences.
Your participants don’t need to be current users of your product but should have interests relevant to your offerings. To find them, surf through online forums and social media or rely on your customer database.
14. Tree testing
If you want to evaluate the information architecture of your product during the mid-design phase, try tree testing.
Recruit participants through social media, online ads, or existing customer databases and ask them to find a way through a simplified, text-only map of your website or app — a “tree.” Their mission is to complete specific tasks like finding a particular piece of information or performing an action.
This quantitative research focuses on measurable outcomes like the success rate of finding information, the time taken to complete tasks, and the paths users take. This data provides clear insights into the effectiveness of your site’s or app’s navigational structure.
15. Analytics
UX research analytics involves exploring user behavior through clues like clicks, form fillings, and other interactions when your product is out in the real world. It’s all about gathering little breadcrumbs of data from actual users to form an overall picture.
This method is quantitative, measuring actions relying on numbers. By analyzing this data, you get objective insights into how users interact with your product, like which features are popular, where they might get stuck, and how they navigate through your site or app.
With UX analytics, every click tells a story, painting a clear picture of user journeys and experiences in the world of numbers.
16. Clickstream analytics
There is a specific type of UX research — clickstream analytics. This method tracks the digital footprints of your users as they hop from page to page on your live site or app. It’s all about mapping their journey, seeing their paths, the stops they make, and for how long. By applying this research technique, you can gain valuable insight into how users navigate, what they like, and where they might run into trouble.
You don’t need to send out invites for a study or round up a group of participants because the data comes directly from the click and scroll of actual users. It’s a continuous stream of information that lets you tweak, adjust, and perfect a visitor’s experience over time.
Clickstream analytics is inherently quantitative. It deals with concrete data like the sequence of pages visited, the time spent on each page, and the transitions between different parts of the site or app. This data helps quantify user behavior, revealing trends and common navigation paths.
17. A/B testing
Split testing, or A/B testing, is a method in UX research where you compare two versions of a webpage or app to see which one performs better. Essentially, you create two different versions — A and B — and show them to users. You analyze which is more effective based on specific metrics like clicks, conversions, or customer engagement.
A/B testing is a quantitative research method all about numbers and measurable results. You’re looking at data from current users to see which version leads to better performance regarding their actions and reactions. This approach provides concrete evidence about which design or content choices are more effective in achieving your goals.
18. Five second testing
Quick and powerful — that’s exactly what five second testing is. The main idea is to show users a webpage, ad, or app screen — for just five seconds. After that brief glimpse, ask questions about what they remember or how they felt to identify the immediate impact and clarity of your designs. This method is flexible and fast, ensuring minimal disruption to your users, whom you can engage through online platforms, social media, or in-person meetings.
The five-second technique can provide both qualitative and quantitative data from the early to mid phases of design. Qualitatively, you can gather insights about participants’ initial feelings and thoughts. Quantitatively, you can measure aspects like recall accuracy, which provides data on the most memorable or attention-grabbing design elements.
19. Prototyping
Another essential step in the UX design process is prototyping, where the design team creates a mini-version of a site or product. This mock-up can be as simple as a hand-drawn paper layout or as sophisticated as interactive HTML pages. The idea is to explore and visualize design concepts before fully implementing them, allowing for adjustments based on feedback.
You can gather qualitative information from the target audience to understand user reactions, thoughts, and feelings about the design. Quantitatively, you can test specific functions, like the ease of navigation or the effectiveness of user interfaces, by measuring task completion time and rates.
20. Competitor analysis and benchmarking
The last critical method is to assess your product compared to others in the market. This involves analyzing the strengths and weaknesses of competitor products and benchmarking them against industry standards. The goal is to understand where your creation stands in the competitive landscape and identify opportunities for improvement or differentiation.
This method is valuable at every stage of your product’s life and can be both qualitative and quantitative. It allows you to analyze things like design style, how user-friendly its features are, and the overall website or app vibe compared to competitors. You can also acquire critical numbers, such as performance metrics, user engagement levels, and conversion rates, that’ll help you identify where your product stands in the market and how it can be improved.
What UX research technique is thought to be the best?
The best UX research technique depends on the specifics of your project, your goals, and the stage of development you’re in. For example, if you’re just starting out with a new app idea and want to understand your potential users’ needs and behaviors, generative research methods like interviews or surveys might be your go-to. These techniques help gather insights that can shape your initial design concepts.
On the other hand, if your app is already developed and you’re looking to refine the user interface, usability testing or A/B testing could be more beneficial. These evaluative methods allow you to observe how users interact with your app and make data-driven improvements.
There isn’t a one-size-fits-all answer — the key is to match the research method with your specific needs at each stage of your project.
How to choose UX research methods
When it comes to picking user experience research methods, a great factor to consider is your company’s budget. The amount of money you’re able to allocate for analysis can guide which strategies are feasible and most effective for your needs. But it’s not the only one, as there are other aspects to consider, which we’ll cover in the following paragraphs.

Define your objectives and problems
When starting with UX research, define your objectives and the problems you aim to solve. This step sets the direction of the study and helps you choose the most effective methods to achieve your goals. Knowing exactly what you want to understand or improve in your user experience guides your entire research process.
When defining your objectives and problems in UX research, we recommend you answer these key questions to set clear goals:
- What are the user’s needs?
- What challenges do the users face?
- How can you address user requirements?
Understand the stage of the design process
Choosing the right UX research methods depends on where you are in the design process. Each stage of your project has unique needs and goals, which require different research approaches and can be divided into three main stages, namely:
- Start of the project. This is the exploratory phase, where you gather initial insights to shape your concept. Methods like user interviews, surveys, and market analysis are ideal to understand user needs and market gaps.
- Formative phase. Here, you are in the process of shaping and testing your design. Techniques like prototyping, usability testing, and card sorting help refine your product, ensuring it meets user expectations and usability standards.
- Summative part. At this final point, your product is complete, and you’re assessing its overall performance. Methods like A/B testing, analytics, and satisfaction surveys are used to evaluate the user experience, measure effectiveness, and identify areas for future improvement.
Each phase has distinct goals, and understanding where you are in the process helps you choose research methods that provide the most valuable insights for that particular stage.
Determine the type of information you need
In UX research, determining the necessary information type will guide you in selecting the most appropriate research methods.
If your goal is to explore more the thoughts, behaviors, and motivations of your users, qualitative methods like interviews and observational studies are your best bet. They give a rich, narrative understanding of customers’ experiences. On the other hand, when looking for concrete, data-driven insights, quantitative methods such as surveys and analytics are more suitable. They provide objective, numerical data that can reveal trends and patterns in user behavior.
Sometimes, a mix of both qualitative and quantitative data is necessary to get a full picture. Such an approach allows you to understand not just what users are doing but also why they’re doing it, combining in-depth insights with measurable facts.
By pinpointing the information you need, you can select UX research methods that provide the most relevant and valuable insights for your project.
Before you start
Eye-tracking, A/B testing, surveys — each method offers unique insights that can shape and refine your website or app development process. By carefully selecting and applying these research techniques, you are equipped to deeply understand user needs, behaviors, and preferences.
Ultimately, the success of a product in the market hinges on how well it meets the requirements and expectations of its customers. Integrating the 20 essential UX research methods outlined above into your development cycle increases the chances of achieving this alignment.
Whether you’re at the concept stage or refining an existing product, these practices provide the necessary data to make informed decisions, ensuring your product is user-centric, innovative, and competitive in an ever-evolving digital landscape.

Frequently Asked Questions
- Tools to use when creating your PoC
You may also like

What is a modal in web design: all you need to know

Halo Lab’s mobile app design process — our workflow and case examples

Effective web design for startups: practical tips & examples
Ready to discuss your project with us, thank you we will contact you asap.

Hmm...something went wrong. Please try again 🙏
Our clients say.

Join Halo Lab’s newsletter!
Get weekly updates on the newest stories, posts and case studies right in your mailbox.
Thank you! We will contact you ASAP!
Integrations
What's new?
In-Product Prompts
Participant Management
Interview Studies
Prototype Testing
Card Sorting
Tree Testing
Live Website Testing
Automated Reports
Templates Gallery
Choose from our library of pre-built mazes to copy, customize, and share with your own users
Browse all templates
Financial Services
Tech & Software
Product Designers
Product Managers
User Researchers
By use case
Concept & Idea Validation
Wireframe & Usability Test
Content & Copy Testing
Feedback & Satisfaction
Content Hub
Educational resources for product, research and design teams
Explore all resources
Question Bank
Research Maturity Model
Guides & Reports
Help Center
Future of User Research Report
The Optimal Path Podcast

User Research
Mar 21, 2024
Creating a research hypothesis: How to formulate and test UX expectations
A research hypothesis helps guide your UX research with focused predictions you can test and learn from. Here’s how to formulate your own hypotheses.

Armin Tanovic
All great products were once just thoughts—the spark of an idea waiting to be turned into something tangible.
A research hypothesis in UX is very similar. It’s the starting point for your user research; the jumping off point for your product development initiatives.
Formulating a UX research hypothesis helps guide your UX research project in the right direction, collect insights, and evaluate not only whether an idea is worth pursuing, but how to go after it.
In this article, we’ll cover what a research hypothesis is, how it's relevant to UX research, and the best formula to create your own hypothesis and put it to the test.
Test your hypothesis with Maze
Maze lets you validate your design and test research hypotheses to move forward with authentic user insights.

What defines a research hypothesis?
A research hypothesis is a statement or prediction that needs testing to be proven or disproven.
Let’s say you’ve got an inkling that making a change to a feature icon will increase the number of users that engage with it—with some minor adjustments, this theory becomes a research hypothesis: “ Adjusting Feature X’s icon will increase daily average users by 20% ”.
A research hypothesis is the starting point that guides user research . It takes your thought and turns it into something you can quantify and evaluate. In this case, you could conduct usability tests and user surveys, and run A/B tests to see if you’re right—or, just as importantly, wrong .
A good research hypothesis has three main features:
- Specificity: A hypothesis should clearly define what variables you’re studying and what you expect an outcome to be, without ambiguity in its wording
- Relevance: A research hypothesis should have significance for your research project by addressing a potential opportunity for improvement
- Testability: Your research hypothesis must be able to be tested in some way such as empirical observation or data collection
What is the difference between a research hypothesis and a research question?
Research questions and research hypotheses are often treated as one and the same, but they’re not quite identical.
A research hypothesis acts as a prediction or educated guess of outcomes , while a research question poses a query on the subject you’re investigating. Put simply, a research hypothesis is a statement, whereas a research question is (you guessed it) a question.
For example, here’s a research hypothesis: “ Implementing a navigation bar on our dashboard will improve customer satisfaction scores by 10%. ”
This statement acts as a testable prediction. It doesn’t pose a question, it’s a prediction. Here’s what the same hypothesis would look like as a research question: “ Will integrating a navigation bar on our dashboard improve customer satisfaction scores? ”
The distinction is minor, and both are focused on uncovering the truth behind the topic, but they’re not quite the same.
Why do you use a research hypothesis in UX?
Research hypotheses in UX are used to establish the direction of a particular study, research project, or test. Formulating a hypothesis and testing it ensures the UX research you conduct is methodical, focused, and actionable. It aids every phase of your research process , acting as a north star that guides your efforts toward successful product development .
Typically, UX researchers will formulate a testable hypothesis to help them fulfill a broader objective, such as improving customer experience or product usability. They’ll then conduct user research to gain insights into their prediction and confirm or reject the hypothesis.
A proven or disproven hypothesis will tell if your prediction is right, and whether you should move forward with your proposed design—or if it's back to the drawing board.
Formulating a hypothesis can be helpful in anything from prototype testing to idea validation, and design iteration. Put simply, it’s one of the first steps in conducting user research.
Whether you’re in the initial stages of product discovery for a new product, a single feature, or conducting ongoing research, a strong hypothesis presents a clear purpose and angle for your research It also helps understand which user research methodology to use to get your answers.
What are the types of research hypotheses?
Not all hypotheses are built the same—there are different types with different objectives. Understanding the different types enables you to formulate a research hypothesis that outlines the angle you need to take to prove or disprove your predictions.
Here are some of the different types of hypotheses to keep in mind.
Null and alternative hypotheses
While a normal research hypothesis predicts that a specific outcome will occur based upon a certain change of variables, a null hypothesis predicts that no difference will occur when you introduce a new condition.
By that reasoning, a null hypothesis would be:
- Adding a new CTA button to the top of our homepage will make no difference in conversions
Null hypotheses are useful because they help outline what your test or research study is trying to dis prove, rather than prove, through a research hypothesis.
An alternative hypothesis states the exact opposite of a null hypothesis. It proposes that a certain change will occur when you introduce a new condition or variable. For example:
- Adding a CTA button to the top of our homepage will cause a difference in conversion rates
Simple hypotheses and complex hypotheses
A simple hypothesis is a prediction that includes only two variables in a cause-and-effect sequence, with one variable dependent on the other. It predicts that you'll achieve a particular outcome based on a certain condition. The outcome is known as the dependent variable and the change causing it is the independent variable .
For example, this is a simple hypothesis:
- Including the search function on our mobile app will increase user retention
The expected outcome of increasing user retention is based on the condition of including a new search function. But, what happens when there are more than two factors at play?
We get what’s called a complex hypothesis. Instead of a simple condition and outcome, complex hypotheses include multiple results. This makes them a perfect research hypothesis type for framing complex studies or tracking multiple KPIs based on a single action.
Building upon our previous example, a complex research hypothesis could be:
- Including the search function on our mobile app will increase user retention and boost conversions
Directional and non-directional hypotheses
Research hypotheses can also differ in the specificity of outcomes. Put simply, any hypothesis that has a specific outcome or direction based on the relationship of its variables is a directional hypothesis . That means that our previous example of a simple hypothesis is also a directional hypothesis.
Non-directional hypotheses don’t specify the outcome or difference the variables will see. They just state that a difference exists. Following our example above, here’s what a non-directional hypothesis would look like:
- Including the search function on our mobile app will make a difference in user retention
In this non-directional hypothesis, the direction of difference (increase/decrease) hasn’t been specified, we’ve just noted that there will be a difference.
The type of hypothesis you write helps guide your research—let’s get into it.
How to write and test your UX research hypothesis
Now we’ve covered the types of research hypothesis examples, it’s time to get practical.
Creating your research hypothesis is the first step in conducting successful user research.
Here are the four steps for writing and testing a UX research hypothesis to help you make informed, data-backed decisions for product design and development.
1. Formulate your hypothesis
Start by writing out your hypothesis in a way that’s specific and relevant to a distinct aspect of your user or product experience. Meaning: your prediction should include a design choice followed by the outcome you’d expect—this is what you’re looking to validate or reject.
Your proposed research hypothesis should also be testable through user research data analysis. There’s little point in a hypothesis you can’t test!
Let’s say your focus is your product’s user interface—and how you can improve it to better meet customer needs. A research hypothesis in this instance might be:
- Adding a settings tab to the navigation bar will improve usability
By writing out a research hypothesis in this way, you’re able to conduct relevant user research to prove or disprove your hypothesis. You can then use the results of your research—and the validation or rejection of your hypothesis—to decide whether or not you need to make changes to your product’s interface.
2. Identify variables and choose your research method
Once you’ve got your hypothesis, you need to map out how exactly you’ll test it. Consider what variables relate to your hypothesis. In our case, the main variable of our outcome is adding a settings tab to the navigation bar.
Once you’ve defined the relevant variables, you’re in a better position to decide on the best UX research method for the job. If you’re after metrics that signal improvement, you’ll want to select a method yielding quantifiable results—like usability testing . If your outcome is geared toward what users feel, then research methods for qualitative user insights, like user interviews , are the way to go.
3. Carry out your study
It’s go time. Now you’ve got your hypothesis, identified the relevant variables, and outlined your method for testing them, you’re ready to run your study. This step involves recruiting participants for your study and reaching out to them through relevant channels like email, live website testing , or social media.
Given our hypothesis, our best bet is to conduct A/B and usability tests with a prototype that includes the additional UI elements, then compare the usability metrics to see whether users find navigation easier with or without the settings button.
We can also follow up with UX surveys to get qualitative insights and ask users how they found the task, what they preferred about each design, and to see what additional customer insights we uncover.
💡 Want more insights from your usability tests? Maze Clips enables you to gather real-time recordings and reactions of users participating in usability tests .
4. Analyze your results and compare them to your hypothesis
By this point, you’ve neatly outlined a hypothesis, chosen a research method, and carried out your study. It’s now time to analyze your findings and evaluate whether they support or reject your hypothesis.
Look at the data you’ve collected and what it means. Given that we conducted usability testing, we’ll want to look to some key usability metrics for an indication of whether the additional settings button improves usability.
For example, with the usability task of ‘ In account settings, find your profile and change your username ’, we can conduct task analysis to compare the times spent on task and misclick rates of the new design, with those same metrics from the old design.
If you also conduct follow-up surveys or interviews, you can ask users directly about their experience and analyze their answers to gather additional qualitative data . Maze AI can handle the analysis automatically, but you can also manually read through responses to get an idea of what users think about the change.
By comparing the findings to your research hypothesis, you can identify whether your research accepts or rejects your hypothesis. If the majority of users struggle with finding the settings page within usability tests, but had a higher success rate with your new prototype, you’ve proved the hypothesis.
However, it's also crucial to acknowledge if the findings refute your hypothesis rather than prove it as true. Ruling something out is just as valuable as confirming a suspicion.
In either case, make sure to draw conclusions based on the relationship between the variables and store findings in your UX research repository . You can conduct deeper analysis with techniques like thematic analysis or affinity mapping .
UX research hypotheses: four best practices to guide your research
Knowing the big steps for formulating and testing a research hypothesis ensures that your next UX research project gives you focused, impactful results and insights. But, that’s only the tip of the research hypothesis iceberg. There are some best practices you’ll want to consider when using a hypothesis to test your UX design ideas.
Here are four research hypothesis best practices to help guide testing and make your UX research systematic and actionable.
Align your hypothesis to broader business and UX goals
Before you begin to formulate your hypothesis, be sure to pause and think about how it connects to broader goals in your UX strategy . This ensures that your efforts and predictions align with your overarching design and development goals.
For example, implementing a brand new navigation menu for current account holders might work for usability, but if the wider team is focused on boosting conversion rates for first-time site viewers, there might be a different research project to prioritize.
Create clear and actionable reports for stakeholders
Once you’ve conducted your testing and proved or disproved your hypothesis, UX reporting and analysis is the next step. You’ll need to present your findings to stakeholders in a way that's clear, concise, and actionable. If your hypothesis insights come in the form of metrics and statistics, then quantitative data visualization tools and reports will help stakeholders understand the significance of your study, while setting the stage for design changes and solutions.
If you went with a research method like user interviews, a narrative UX research report including key themes and findings, proposed solutions, and your original hypothesis will help inform your stakeholders on the best course of action.
Consider different user segments
While getting enough responses is crucial for proving or disproving your hypothesis, you’ll want to consider which users will give you the highest quality and most relevant responses. Remember to consider user personas —e.g. If you’re only introducing a change for premium users, exclude testing with users who are on a free trial of your product.
You can recruit and target specific user demographics with the Maze Panel —which enables you to search for and filter participants that meet your requirements. Doing so allows you to better understand how different users will respond to your hypothesis testing. It also helps you uncover specific needs or issues different users may have.
Involve stakeholders from the start
Before testing or even formulating a research hypothesis by yourself, ensure all your stakeholders are on board. Informing everyone of your plan to formulate and test your hypothesis does three things:
Firstly, it keeps your team in the loop . They’ll be able to inform you of any relevant insights, special considerations, or existing data they already have about your particular design change idea, or KPIs to consider that would benefit the wider team.
Secondly, informing stakeholders ensures seamless collaboration across multiple departments . Together, you’ll be able to fit your testing results into your overall CX strategy , ensuring alignment with business goals and broader objectives.
Finally, getting everyone involved enables them to contribute potential hypotheses to test . You’re not the only one with ideas about what changes could positively impact the user experience, and keeping everyone in the loop brings fresh ideas and perspectives to the table.
Test your UX research hypotheses with Maze
Formulating and testing out a research hypothesis is a great way to define the scope of your UX research project clearly. It helps keep research on track by providing a single statement to come back to and anchor your research in.
Whether you run usability tests or user interviews to assess your hypothesis—Maze's suite of advanced research methods enables you to get the in-depth user and customer insights you need.
Frequently asked questions about research hypothesis
What is the difference between a hypothesis and a problem statement in UX?
A research hypothesis describes the prediction or method of solving that problem. A problem statement, on the other hand, identifies a specific issue in your design that you intend to solve. A problem statement will typically include a user persona, an issue they have, and a desired outcome they need.
How many hypotheses should a UX research problem have?
Technically, there are no limits to the amount of hypotheses you can have for a certain problem or study. However, you should limit it to one hypothesis per specific issue in UX research. This ensures that you can conduct focused testing and reach clear, actionable results.
A Beginner’s Guide to Qualitative UX Research
The ability to empathize with the user is at the heart of UX design. One of the most effective ways to understand what your user is experiencing is by conducting UX research .
Qualitative user research is particularly useful for getting into the mind of your users and obtaining anecdotal evidence of how your product can be improved.
Unlike its counterpart, quantitative research, qualitative research is all about collecting and analyzing subjective information that helps designers make formative decisions about their product designs. There are many ways to utilize qualitative user research and many instances during the design process when it can be especially beneficial.
We’ve created this comprehensive guide to help you better understand qualitative user research and how to use it. Here’s what we’ll cover:
- What is qualitative UX research?
- When do you use qualitative UX research?
- Qualitative UX research methods
- Understanding mixed methods in UX research
- Key takeaways
Let’s get started!
1. What is qualitative UX research?
The goal of qualitative user research is to obtain and analyze non-numerical, subjective information from various kinds of user testing.
Data from qualitative user research usually takes the form of quotes, anecdotes, observations, or narrative descriptions and is used to assess how usable a product is.
Qualitative user research helps explain numerical or quantitative data. For instance, if your quantitative research shows that 30% of users are deleting your app after one month of use, qualitative data can help uncover why and give clues about how to remedy this drop-off.
Check out the video below from CareerFoundry graduate and UX designer Maureen Herben for an end-to-end guide to qualitative user research.
2. When do you use qualitative UX research?
Qualitative user research is both formative and summative, meaning it can help inform design choices while a product is being created as well as analyze how effective the final design is.
Because of this, qualitative user research is often conducted at many points in the design process, during redesign, and when you have a final working product. Here’s an overview of the benefits of qualitative research, some potential downsides, and situations when you should apply qualitative methods in your user research.
Benefits of qualitative UX research
- Easy to organize as you only need 5-8 participants and study conditions can be flexible and less controlled
- Participants are encouraged to think aloud during usability testing so researchers can see inside the minds and emotions of their users when interacting with a product
- Reveals information that quantitative data cannot, and explains why numerical or statistical trends are occurring
- Data obtained from qualitative user research is emotionally-driven and may be more convincing for stakeholders to invest in design choices
- Users may find it easier to give feedback in their own words rather than assigning a numerical value to their feelings.
Potential downsides to qualitative UX research
- Analysis can be more time-consuming and complex and difficult to present in graphs or visual form
- Smaller number of participants may mean that you’re missing out on crucial information from other users, leading to the need for repeat testing
- Researchers must be adept at reading emotional and non-verbal cues
- Certain investors or stakeholders may prefer numerical or statistical data as opposed to anecdotal, qualitative research
- More subject to human bias or researcher influence, and results are difficult to replicate
When to use qualitative UX research
- When you’re making formative decisions about design choices, early in the process
- To identify usability issues within a prototype (toward the “end” of the design process) or a final product
- As a means of discovering solutions to usability issues
- During a product redesign, when there are typically more resources available and more capacity to consider a broader range of possibilities
3. Qualitative UX research methods
There are many ways to conduct qualitative user research. We’ll cover four primary methods here: user interviews, focus groups, shadow sessions, and diary studies.
User interviews
User interviews are a great source of qualitative user data and help researchers and designs gain a greater understanding of their user’s motivations, needs, and behaviors.
It’s important to ask quality open-ended questions in order to gain relevant and useful information about the user’s actions and frustrations.
User interviews are one of the most frequently used qualitative UX research methods. If you’d like to learn more about how to conduct a user interview, check out this recording of a live workshop, hosted by CareerFoundry graduate and Senior UX Designer, Maureen Herben.
For more free, live and on-demand workshops just like this, take a look at our events listings .
Focus groups
Focus groups are just like interviews but with multiple users participating at once. These are great for getting lots of qualitative data at once from various user viewpoints.
These sessions are likely to feel more conversational and generative since participants may feel more at ease with other test subjects around them—and therefore more willing to express concerns, thoughts, and emotions.
Shadow sessions
Sometimes called immersive or observational research, shadow sessions allow designers and researchers to observe a user interacting with a product in real time and in the user’s own environment.
This is one of the most accurate ways to assess usage and usability but also requires a high level of observational skills and empathy in order to analyze verbal and non-verbal cues without interrupting the user’s natural process.
Diary studies
In diary studies (sometimes referred to as diary records), researchers ask a user to keep a diary record of their usability patterns with a certain product over a given time period (usually a day or week, but sometimes more).
Users take note of how they use a product, when they use it, and how they feel when interacting with it. Diary studies are a great way to see what patterns emerge over time—patterns in user needs and feelings, as well as any usability problems or other pain points.
4. Understanding mixed methods in UX research
The UX research methods we’ve just outlined are solely qualitative in nature. But there are loads of research methods that yield both qualitative and quantitative user data within the same testing parameters. Paper prototyping, card sorting, and visual affordance testing are a few examples.
Utilizing user research methods that offer both qualitative and quantitative UX research is referred to as mixed methods research . Mixed methods research is key to obtaining a complete picture of the usability of a product and is best practice when it comes to conducting accurate user research.
Combining qualitative and quantitative user research methods helps designers dig deeper in answering the questions of “What? How much? How many? And why?”
Relying too heavily on either qualitative or quantitative user research can prevent you from gaining key insights about your users and possible pitfalls in your product. Taking advantage of mixed methods research is a more holistic approach to user research, and often lends more accurate and complete information about a product’s overall usability and effectiveness.
5. Key takeaways
Now you’re better equipped for your next UX research project !
Qualitative user research can take on many forms, yet each method can offer invaluable insights about the usability of a product.
The subjective and non-numerical data obtained from qualitative testing helps designers and researchers see into the minds of their users when interacting with a product.
Through quotes, descriptions, and observations, qualitative research aims to further explain statistical or quantitative results by looking at why those trends may be occurring, and gives a more in-depth interpretation of the usability and success of a product.
If you’d like to learn more about UX research, check out these articles:
- What is user research, and what’s its purpose?
- Qualitative vs. quantitative UX research—what’s the difference?
- How to conduct inclusive user research
- 5 Mistakes to avoid in your UX research portfolio
UX research guide
0 % Complete
UX research plan
How to recruit participants for ux research, ux research methods, ux research analysis, understanding ux research analysis, what’s the difference between ux research analysis and ux research synthesis, when should you conduct ux research analysis, quantitative vs qualitative ux research analysis, how to analyze ux research data: step-by-step, navigating ux research analysis, ux research report.
UX research analysis is the key to unlocking your research efforts. It’s the process of systematically examining the data you’ve collected during your research study, whether through user interviews, surveys, usability tests, or other methods. By doing so, you extract valuable insights that guide your design and product decisions and enhance the user experience of your product or service. In chapter, you’ll gain a deep understanding of how to conduct UX research analysis effectively. Whether you’re new to UX research or a seasoned pro, this chapter will equip you with the skills and knowledge needed to extract meaningful insights from your data.
UX research analysis involves organizing, classifying, and interpreting the data you collect during your research study – like user interviews , surveys , or usability tests – and making sense of it so you can make informed and actionable recommendations.
When you conduct a UX research analysis, you’re essentially asking:
What can the data reveal about user needs?
How are users interacting with our product?
What challenges are users facing?
How can this information shape our design decisions?
A UX research analysis tackles both qualitative and quantitative data. But whether you’re dealing with numbers or narratives, the aim is the same: to uncover meaningful patterns and themes that shed light on user behavior and product usability. These insights can then guide product teams toward addressing user needs and pain points.
When it comes to navigating UX research, terms like analysis and synthesis often get thrown around. But do they really mean the same thing? Before we get into the how-to’s, it’s worth understanding the key differences between these terms.
At its core, analysis involves sorting and categorizing data. You’re dissecting raw information and organizing it into manageable pieces. In UX research, this usually involves working with qualitative data, such as interview transcripts.
Synthesis takes an interpretive route. It’s about looking beyond the data and seeking patterns, connections, and meaningful relationships. In UX research, this involves spotting themes that connect user experiences, crafting coherent explanations, and building insights. This is the phase where you form groups of notes on an affinity map, merge various themes from multiple interviews, and make actionable recommendations.
Analysis and synthesis can happen at different stages, but they often happen at the same time. Through analysis you’ll be able to identify findings, and through synthesis you can turn those findings into insights.
So, when should you begin analyzing all that valuable data you’re gathering? While the obvious answer might be after your study ends, it’s good practice to start analyzing a few steps earlier.
Before you even begin your research, you should have clearly defined objectives and research questions . Incorporating this step into your research plan lets you bake analysis into your study from the outset. With a clear vision, you’ll know exactly what to look for when conducting your analysis, which will prevent you from getting lost in a sea of data.
As you start gathering data, conduct on-the-go analysis. This practice helps you spot any potential issues early on. For example, say you’ve conducted a couple of user interviews – by doing some early analysis of your interview transcripts, you might notice that some of your questions are steering the research away from meeting your objectives. Because you’ve caught this early, you’ll be able to fix any issues before conducting further interviews.
Starting your analysis early can also save you time at the end of the project. But it’s worth noting that most analysis will happen at the end of your study. By this point, you should have your raw data, tagged notes, and initial analysis ready – now, it’s time to dive deep.
We’ll get into the specifics of how to conduct this analysis shortly, but first, let’s explore the various types of analysis you can do.
As we explored in the UX research methods , there are two types of user research: quantitative and qualitative . Each approach serves its purpose and requires specific techniques to make sense of the data.
Quantitative research deals with objective, measurable data – think completion rates, task durations, and error rates. It’s all about finding concrete answers to questions like “How many users successfully completed a specific action” or “How long did it take them to navigate through a particular feature?”. This type of analysis unveils the “what” and “how” of user behavior, shedding light on user actions and interactions within a product or service.
e uncovers subjective experiences using words. This method captures the depth of user interactions – their feelings, opinions, and thoughts. When analyzing qualitative data, the goal is to identify recurring themes and patterns. This kind of analysis uncovers insights about what resonates with users, how they emotionally connect with an experience, and where they encounter challenges. Bearing in mind the depth of insights means analyzing qualitative data often takes more time compared to quantitative analysis.
Depending on your research objectives and questions, you might opt for one method or find value in combining the two. While they lead to different insights, the ultimate goal remains the same – to understand your users and how to optimize their experience.
Tips for conducting quantitative research analysis
In the world of UX research, quantitative analysis deciphers patterns to unveil the “how” and “why” behind user interactions with your product.
Below are some top tips on how to analyze quantitative data.

Organize your quantitative data
When you conduct a quantitative study, you’ll find yourself with lots of data. You might have the data neatly arranged in a spreadsheet, with each column representing a question and each row containing a participant’s responses, or you might need to manually compile data from various sources. Either way, organizing your datasets in a manageable way will help bring structure to your analysis.
Use data analysis tools and software
Once your data is neatly organized, it’s time to undertake statistical analysis. Tools like R, Python, SPSS, and Excel can help you crunch the numbers and unearth valuable insights.
Most user research tools will have some analysis functionality built in. In Lyssna, there are various reporting and analysis features available to make this task easy to manage.
Define your focus
Before you start drawing any insights, revisit your study’s core objectives. What questions are you seeking to answer? For example, you might want to determine how long it takes for a user to complete a task or gauge their satisfaction at different stages of a checkout process. Concentrate your analysis on these key questions.
Consider variables
Common variables explored in quantitative analysis include success rates, task completion times, and error rates. You might also assess the overall user experience through survey responses or behavioral data. Demographic and geographic data can also be folded into the analysis, offering insights into user patterns among specific groups.
Tips for conducting qualitative research analysis
Qualitative research analysis involves carefully reviewing non-numerical data collected from sources like user interviews, focus groups, or diary studies. Here’s how to best approach it.

Transcribe and tag your qualitative data
If your research involves spoken or written responses from participants, such as interviews, you’ll need to transcribe this data. Transcription tools like Rev and Otter can streamline this process. In Lyssna, automated transcripts for user interviews are built in.
You’ll also need to consider how you’ll tag your data. Some UX research tools , like Dovetail and UserTesting , include transcription and tagging features, which can also help streamline this process. Other popular tagging tools include Miro and Airtable .
Align with your research goals
Before you dive into your analysis, revisit your research objectives to make sure your analysis aligns with them. For example, if your goal is to understand user preferences regarding a product’s user interface, focus your analysis on responses relevant to this goal.
Focus areas for qualitative analysis
To make your qualitative analysis more effective, consider the following focus areas as you explore the data:
Patterns and themes: Look for significant patterns and common themes that emerge from users’ responses. These recurring elements often hold valuable insights.
Surprising findings: Take note of any unexpected findings. Investigate these surprises to uncover their potential implications and significance.
Emotional responses: Pay attention to the contexts in which users express significant emotional responses to questions. Emotions can reveal critical aspects of the user experience.
Feature importance: Determine which product features hold the highest importance for users. Insights into feature prioritization can guide future design decisions.
Likes and dislikes: Explore what users like most and least about the product, and delve into the reasons behind these preferences. This can highlight areas for improvement.
User values: Examine the core values that hold significance for users in the context of your research. This can inform product alignment with user values.
User groups: Explore how responses differ across groups – this can provide insights into diverse user needs and preferences.
User stories: Seek out intriguing user stories – they can provide an interesting narrative that illustrates user experiences and challenges.
Overall product perception: Look for responses to how users perceive the product as a whole and where it fits into their daily lives. This can help you understand the overall user experience.
Unmet use cases: Look for any gaps that users highlight – identifying these gaps can drive enhancements in the user experience.
How to choose a suitable quantitative analysis approach
In quantitative research analysis, two popular analysis methods are content analysis and affinity mapping. These techniques help you extract meaningful insights from qualitative data.
Content analysis
Content analysis can help you uncover valuable patterns in your data and label them for deeper understanding. In UX research, content analysis is particularly useful when dealing with lots of text, like interview transcripts.
Here’s how to conduct a content analysis:
Define your codes: The first step is to decide on the codes you’ll use. You can either define codes based on topics you expect to find or let them emerge naturally as you delve into the data. For example, if you’re analyzing customer feedback, codes like “pricing,” “usability,” and “customer support” might come up.
Assign codes along the way: As you sort through the data, apply these codes. You can do this manually or use a qualitative analysis program (like the ones mentioned above) to streamline the process. For example, if you’re reviewing interview transcripts and a participant shared their frustrations with app navigation, you could apply codes like “usability” and “navigation.”
Organize codes into themes: To make sense of the coded data, group related codes under broader categories. For example, codes like “user interface” and “menu layout” might fall under the theme of “app navigation.”
If multiple team members are involved in coding transcripts, make sure everyone is on the same page. You can test this by having each team member code a small section of data and compare the results. You can then chat through any discrepancies until you reach a consensus on how to apply the codes.
Affinity mapping
Affinity mapping is a method used to transform a large volume of raw data into structured and actionable insights. This technique is especially useful when analyzing user interviews, surveys, or open-ended responses .
Here’s a brief overview of how to create an affinity map.
Collect and segment your data: Gather all the qualitative data you’ve collected. This could be notes, quotes, or excerpts.
Hold an affinity mapping session: Create physical or digital cards for each data point. During the session, have participants organize the cards into groups (you could use sticky notes or collaboration tools like Miro, InVision, or Figma).
Identify patterns and insights: As you arrange the cards, you’ll start to notice connections between different data points. Some cards may cluster together, indicating strong themes or recurring insights. This step helps you identify patterns and relationships that might not have been apparent in the raw data.
Synthesize insights and make recommendations: Once your affinity map is complete, step back and analyze the bigger picture. Synthesize the insights you’ve uncovered and use them to derive actionable recommendations. These recommendations are grounded in the patterns you’ve discovered, making them more robust and relevant to your research objectives.

Now that we’ve covered the different approaches you can take to analyze your UX research data, it’s time to dive into the analysis process itself. In this section, we’ll walk you through each step.
By following these steps, you’ll effectively transform raw data into actionable insights. This process not only enhances your understanding of user behavior but also equips you to provide valuable recommendations that contribute to creating more user-centered products and services.
1. Collect and organize your UX research data
We covered this in the quantitative and qualitative analysis tips above, but begin by gathering data from the various research methods you’ve used in your study, like interviews, surveys, or usability tests.
Keep things organized and structured using spreadsheets, note-taking tools, or specialized research platforms. Well-organized data is important for efficient analysis.
2. Revisit your research objectives
Before diving into analysis, revisit your initial research objectives. These objectives will help you stay on course and extract insights that directly address the aims of your study.
For example, say you’re conducting research for a collaboration tool aimed at improving remote team productivity. Your initial research objectives might include “Discover the main pain points users experience when working remotely” and “Determine which features are most valuable to remote teams.” Reminding yourself of these objectives helps you focus on aspects relevant to your research goals.
3. Uncover findings
Now, it’s time to unearth some hidden gems. This involves coding and tagging your data to categorize different types of information. Look for recurring themes, patterns, and trends that span across different data points. This might involve identifying common pain points, user preferences, or behavioral trends.
Whether you’re dealing with quantitative or qualitative data, you’re on the hunt for patterns and trends. Each finding should be prioritized based on severity and importance, always aligned with your research objectives.
Top tip: Coding data is a useful technique, especially for structuring lengthy text like interview transcripts. It involves tagging relevant insights and observations with concise phrases. For example, if a user mentions difficulties with the checkout process, you could use “Checkout issues” as a code. You can use these codes to categorize and structure your data, making it easier to identify patterns and draw meaningful insights during analysis.
4. Synthesize your findings
With your patterns and trends identified, it’s time to weave them into a coherent narrative. Group related findings together to create insights into user behavior, needs, and motivations. As we explored at the start of this chapter, synthesis is all about crafting a comprehensive story that showcases the bigger picture and the connections between various insights.
What’s the difference between findings and insights?
Findings and insights are often used interchangeably, so let’s take a quick moment to understand the difference between these terms.
A finding is a fact or statement that describes what’s happening, while an insight delves into human behavior or user motivation, guiding potential solutions.
For example, a finding might be “Users abandon the checkout process due to excessive form fields.” An insight from this finding might be, “Simplify the checkout process to enhance user satisfaction.”
Top tip: Consider various approaches for synthesizing your data, such as storytelling, empathy maps, or brainstorming sessions . Your aim is to transform data into actionable insights.
5. Make recommendations
Your insights hold the power to drive change and improvement. Translate these synthesized insights into actionable recommendations. Align each recommendation with your initial research objectives and outline their potential impact on user experience and business goals. Provide a hierarchy of recommendations based on importance and feasibility.
Use user statements, “how might we” questions, and video clips of users to translate complex insights into plain language. If insights are feasible, desirable, and viable, they can initiate new design and marketing initiatives. You might even be asked to weigh in on briefs that will kick off these projects and even help during development to make sure they align with user needs.
Now, your insights are ready to be shared with your stakeholders and your team! User research comes full circle when insights guide decision-making. Share your findings according to your organization’s culture, whether through a written report, a presentation, a workshop, or a combination of these approaches. We delve into the specifics of reporting in the UX research report chapter .

In this chapter, we’ve explored the essential process of UX research analysis, a critical phase in the journey toward creating user-centered products.
Here are some key takeaways:
Analysis vs synthesis: Understanding the distinction between analysis and synthesis is crucial. While analysis involves categorizing data, synthesis uncovers patterns and relationships in that data.
When to start your analysis: If possible, start your analysis early, aligning it with your research objectives. This can save you time later down the track, as can conducting on-the-go analysis to spot potential issues.
Quantitative vs qualitative analysis: Each approach offers unique insights into user behavior and experiences. Quantitative analysis offers an objective view of user behavior, looking at the “what” and “how” of user interactions. Qualitative analysis deals with non-numerical data, delving into the “why” behind user behavior.
Equipped with these insights, you can now confidently navigate the intricate landscape of UX research analysis.
Previous page
Product Design (UX/UI) Bundle and save
User Research New
Content Design
UX Design Fundamentals
Software and Coding Fundamentals for UX
- UX training for teams
- Hire our alumni
- Student Stories
- State of UX Hiring Report 2024
- Our mission
- Advisory Council
Education for every phase of your UX career
Professional Diploma
Learn the full user experience (UX) process from research to interaction design to prototyping.
Combine the UX Diploma with the UI Certificate to pursue a career as a product designer.
Professional Certificates
Learn how to plan, execute, analyse and communicate user research effectively.
Master content design and UX writing principles, from tone and style to writing for interfaces.
Understand the fundamentals of UI elements and design systems, as well as the role of UI in UX.
Short Courses
Gain a solid foundation in the philosophy, principles and methods of user experience design.
Learn the essentials of software development so you can work more effectively with developers.
Give your team the skills, knowledge and mindset to create great digital products.
Join our hiring programme and access our list of certified professionals.
Learn about our mission to set the global standard in UX education.
Meet our leadership team with UX and education expertise.
Members of the council connect us to the wider UX industry.
Our team are available to answer any of your questions.
Fresh insights from experts, alumni and the wider design community.
Success stories from our course alumni building thriving careers.
Discover a wealth of UX expertise on our YouTube channel.
Latest industry insights. A practical guide to landing a job in UX.
The 10 best UX research tools to use in 2023
In this guide, we introduce 9 of the best UX research tools on the market right now. We’ll also share some advice on how to choose the most suitable tools for your work.

Free course: Introduction to UX Design
What is UX? Why has it become so important? Could it be a career for you? Learn the answers, and more, with a free 7-lesson video course.

All good UX begins with user research—and all good user research relies on the right tools.
But, with so many tools to choose from, where do you even start?
Look no further. In this guide, we introduce 9 of the best UX research tools on the market right now. We’ll also share some advice on how to choose the most suitable tools for your work.
What is UX research and why does it matter?
- 9 of the best UX research tools available in 2023
How to choose the right tools for your UX research
Ready to become a user research pro? Let’s begin.
[GET CERTIFIED IN USER RESEARCH]
Before we explore the best tools for the job, let’s recap on what exactly UX research is—and why it’s so important.
UX design is all about solving a real problem for real, human users. UX research helps you to identify the problem you need to solve, and to understand how best to solve it based on what you know about your users.
Without user research, you’re basing your work on assumptions. This inevitably leads to a mismatch between the user experience and the people you’re designing it for—i.e. bad UX!
That’s why all good designers start their UX process with research. UX research involves:
- Conducting interviews, surveys, card sorting exercises and focus groups (to name a few!) with real or representative users to see what they expect from the user experience and what pain-points they currently encounter
- Analysing the data gathered to uncover key themes and user problems
- Defining the scope of the problems uncovered and determining what to prioritise
- Sharing your findings with key stakeholders
- Continually testing and iterating on your designs to optimise the user experience
You can learn more about what UX research is in this dedicated guide .
What’s the difference between qualitative and quantitative research?
As you consider what tools to use for your UX research, it’s important to distinguish between quantitative and qualitative research.
Quantitative user research gathers objective, measurable data that can be quantified (i.e. counted). Some examples of quantitative data might be the number of clicks it takes a user to complete their desired task on a website, or the percentage of users who bounce in a given time frame.
Qualitative user research isn’t concretely measurable, but it can give you much deeper insights into how your users think, feel and behave. For example, if you conduct interviews to find out how your users feel about a particular product, that’s qualitative research. Likewise, if you observe a user trying to navigate an app and note down that they get really frustrated, that’s qualitative data.
UX designers tend to conduct both qualitative and quantitative research for a broad and detailed picture of their users.
What’s the difference between moderated and unmoderated user research?
Another distinction to be aware of is that between moderated and unmoderated research.
Moderated UX research takes place with the user researcher present. If you’re interviewing a user live via video call, or observing them while they complete a certain task and asking follow-up questions, you’re conducting moderated UX research.
Unmoderated UX research takes place without your supervision. This includes things like surveys which the user answers in their own time, or usability tests where the user might record their screen while they interact with your website.
What are the best UX research tools?
Now we know about the different types of user research you might conduct, let’s explore some of the best UX research tools on the market right now.
1. Optimal Workshop for card sorting, tree testing and first-click testing

Optimal Workshop isn’t just a user research tool—it’s an entire toolbox. You can use it to conduct both qualitative and quantitative user research, and to recruit participants.
Optimal Workshop allows you to see participant responses as they come in, and to view your data in the form of easy-to-understand visualisations—ideal for sharing your insights with others.
You can use Optimal Workshop to conduct card sorting exercises, tree testing, first-click testing, and surveys.
Optimal Workshop comprises 5 tools:
- OptimalSort , a card sorting tool that shows you how your users categorise information. This is useful when mapping out the information architecture of a website or app.
- Treejack , a tree testing tool that shows you how easily people can find information on your website or app—and where they get lost.
- Chalkmark for first-click testing. This enables you to test the usability of an existing design. You can upload screenshots, sketches or wireframes and test to see if users are able to navigate with ease.
- Questions for creating and sending out online surveys. You can attach wireframes or sketches for more specific feedback.
- Reframer for note-taking and documentation. This is useful for organising all your qualitative research insights in one place. Reframer is actually number 8 on our list, so more on that later!
Main features at a glance:
- 1 platform, 5 tools for card sorting, tree testing, first-click testing, surveys, and documenting qualitative research insights
- Participant recruitment service (available in 70+ languages)
- View participant responses as they come in
- Data visualisations accessible via the Optimal Workshop dashboard
How much does it cost?
Optimal Workshop offers a free plan with no requirement to upgrade. If you do want more functionality, paid options include:
- The Starter plan for small-scale research projects at $99/month (approx. €88).
- The Pro plan for unlimited studies at $166/month (approx. €150) for 1 user.
- The Team plan for unlimited studies at $153/month per user (approx. €140) for up to 3 users.
2. Looppanel for user interviews and usability tests

Looppanel is an AI-powered research analysis & repository product that makes it 5x faster to discover and share user insights.
Looppanel acts like your research assistant: it records, transcribes, creates notes, and organizes your data for easy analysis.
Teams like PandaDoc, Huge Inc., Airtel, and others use Looppanel to streamline research analysis and build their insights repository.
Main Features at a glance
- Automatically generated notes for user interviews
- 90%+ accuracy transcription in 8 languages
- Integrations with Zoom, Google Meet, Teams to auto-record calls
- Time-stamped notes taken live during interviews
- Ability to tag and annotate on transcripts
- 1-click to create shareable video clips
- Analysis workspace to view project data by question or tag
- Search across projects
Looppanel offers a free 15-day trial. After that, you can choose from a range of paid plans:
- Starter (for small teams / solo researchers): An affordable starter plan for $30/month that includes 10 transcription hours / month
- Teams: For teams of 3+ researchers, this plan is priced at $350/month and comes with 30 transcription hours / month
- Business: For organizations with large teams or significant security requirements, the business plan costs $1,000/month for 120 transcription hours / month
- Custom: For enterprise teams of larger sizes
3. Lookback for user interviews
Lookback is a video research platform for conducting both moderated and unmoderated user interviews and usability tests.
The collaborative dashboard allows you to sync all your research, tag your teammates, and create highlight reels of all the most useful insights. You can set up virtual observation rooms, record users’ screens as they navigate your app or website, and transcribe your user interviews.
- Moderated and unmoderated video interviews and user testing sessions
- Timestamped notes captured live during sessions
- Virtual observation rooms: Invite stakeholders to observe user research sessions and chat with each other in a separate virtual room
- Screen capturing: Watch and record participant touches on mobile screens during interactions
- Create highlight videos and compile them into highlight reels
- Collaborative dashboard
Lookback offers a free 14-day trial. After that, there are a range of paid plans to choose from:
- Freelance: An affordable solo plan for $17/month (approx. €15). Includes 10 sessions/year.
- Team: $99/month (approx. €90) for 100 sessions/year.
- Insights Hub: $229/month (approx. €205) for 300 sessions/year.
4. Typeform for surveys
Surveys are a UX research staple, offering a quick, easy and inexpensive way to gather user insights. When sending out surveys for UX research, you’ll usually ask questions about the respondents’ attitudes and preferences in relation to the product or service you’re designing.
Typeform is one of the most popular survey tools among UX designers. With Typeform, you can design your own surveys from scratch or choose from a range of templates. After you’ve distributed your survey, you can see responses and completion rates and generate shareable reports.
- Dozens of UX research templates, including a user persona survey template , a product research survey template and a product feedback template
- Conditional logic to ensure that users only see relevant follow-up questions based on their previous answer
- Shareable reports after survey completion
- Integrations for Google Sheets, Slack, Airtable and more
Typeform has a free plan with unlimited forms, 10 questions per form, and 10 responses per month. You can stay on the free plan for as long as you like, or upgrade for additional features:
- Basic: €21/month (1 user, unlimited typeforms, up to 100 responses/month)
- Plus: €46/month (3 users, unlimited typeforms, up to 1,000 responses/month)
- Business: €75/month (5 users, unlimited typeforms, up to 10,000 responses/month)
View all price plans and features on the Typeform website .
5. Maze for user surveys, concept validation, and wireframe & prototype testing
Maze is another UX research all-rounder with a focus on rapid testing. You can use it for card sorting, tree testing, 5-second tests, surveys, and to test wireframes and prototypes on real users.
Maze integrates with all the industry-standard UX tools like Figma, Sketch, Adobe XD and InVision. It’s even got a built-in panel of user testers, promising user insights in less than 2 hours.
Maze also handles the analytics, presenting your research insights in the form of a visual report.
- Prototype testing to validate your designs before developing them
- Tree testing to ensure your information architecture is user-friendly
- 5-second testing to assess user sentiment when first interacting with your product
- Surveys to scale your UX research
- Card sorting to help plan or test your product’s information architecture
- Built-in panel of over 70,000 testers
- Analytics and visual reports
[GET CERTIFIED IN UX]
6. UserZoom for surveys, card sorting, click testing, and usability tests

Similar to Optimal Workshop and Maze, UserZoom is a complete UX research toolbox used for card sorting, usability testing, surveys, click testing, tree testing, and user interviews. The platform also includes a fully-integrated participant recruitment engine with over 120 million users worldwide.
- Moderated and unmoderated usability testing
- Surveys for quickly gathering user feedback at scale
- Click testing to evaluate early stage concepts
- Open and closed card sorting to inform your information architecture and understand your users’ mental models
- Interviews to gather self-reported insights from your users
- Tree testing to assess your information architecture
- Participant recruitment engine with over 120 million users worldwide
- Integrations with Adobe XD, Miro, Jira, Mural, Typeform and more
UserZoom offers custom price plans depending on your needs. Find out more here .
7. dscout for remote user interviews and diary studies
A versatile suite of research tools, dscout is ideal for conducting remote user studies.
There are four main pillars of the dscout platform: Diary, Live, Recruit, and Express.
Diary is a remote diary studies tool which allows you to gather contextual, qualitative insights into user behaviour and experiences. If you’re new to diary studies, dscout has put together a helpful guide on how and why to conduct diary studies here .
Live is a user interview tool, and Express is a flexible user survey solution. Recruit is the final piece in the puzzle: a panel of over 100 thousand users you can enlist for your UX research.
- Diary for conducting remote diary studies
- Live for user interviews with auto-transcribe, real-time note-taking and screen-sharing capabilities
- Express for user surveys
- Recruit, a built-in panel of 100 thousand user research participants
- Research synthesis and analysis: automatically generate charts and word clouds
- Loads of guides, resources and templates to help you get started
dscout offers customisable subscription plans depending on your needs. You can learn more about the different plans and request a quote here .
8. Hotjar for analytics and heatmaps
Hotjar is a powerful behaviour analytics tool that enables you to really see how your users engage with an existing product.
You can use Hotjar to send out surveys, capture and watch screen recordings of people interacting with your website, create heatmaps, and gather real-time user feedback. Hotjar is all about stepping into your users’ shoes and improving the user experience accordingly!
- Heatmaps to see where users click and how they navigate your site. This is helpful for identifying any usability issues or UX flaws
- Screen recordings to see first-hand how people interact with your product
- Real-time user feedback via a suggestion box integrated into your website
- Surveys and survey templates
- Integrations with Slack, Miro, Jira, Asana and more
Hotjar’s basic free plan is pretty extensive, offering up to 35 daily sessions, unlimited heatmaps, and up to 1,050 recordings per month. For more research capability, paid plans include:
- Plus: €31/month —ideal for small teams
- Business: €79/month —for growing companies and websites
- Scale: €311/month —for large companies and websites
See Hotjar’s price overview for more information.
9. Reframer for analysing qualitative research
Reframer is part of the Optimal Workshop suite of UX research tools (number 1 on our list), but we think it’s worth a special mention. As UX designer Carrie Nusbaum notes in her own review of Reframer : “There are many tools that support the act of actual user testing, and many that facilitate design. Relatively few tools, however, specifically support some important steps that take place in between, namely: data organisation, research synthesis, and presentation of findings.”
Reframer seeks to fill this gap. It’s a unique tool dedicated to capturing all your qualitative research notes in one place, helping you to analyse and make sense of them. It’s your “qualitative research sidekick”, bringing some much-needed structure to the often messy task of qualitative research.
- Directly capture research observations straight into Reframer; no Post-it notes or separate Google Doc needed
- Theme builder: easily construct a coding system with tags and build out themes for your research findings
- Chord and bubble charts to visualise your findings and easily spot patterns and trends
- XLS export: you can export your research as a .xls file, enabling you to transfer it to other tools and platforms if needed
You can use Reframer as part of the Optimal Workshop toolbox. Optimal Workshop offers a free plan which you can use for as long as you like. For increased functionality, the following paid plans are available:
10. Asana for planning and organising your UX research
Asana isn’t a UX research tool per se, but it’s an excellent tool for organising and keeping track of all your research projects.
With the Timeline feature, you can create project plans to see exactly what’s happening and when, or visualise your workflow with a Kanban-style board . This allows you to drag and drop cards into different columns depending on their status (e.g. in progress, awaiting feedback, done).
You can add multiple collaborators to different projects, assign various tasks to individual team members, and provide updates via the commenting function.
Asana essentially has everything you need to manage your research projects collaboratively from start to finish.
- Shared team calendar for an overview of who’s working on what, and when
- Visual project management in the form of lists or boards, with the ability to break projects down into smaller subtasks and assign them to different stakeholders
- Project briefs and templates to standardise and streamline your workflows
- In-platform communication via task comments or private messaging
- Integrations with Slack, Google Drive, Dropbox, email, and more
You can use the free basic version of Asana for as long as you like, with extensive capabilities (ideal for individuals and smaller teams). For more robust project management, Asana offers two paid plans:
- Premium at €10.99/user per month
- Business at €24.99/user per month
You’ll find more information on Asana’s pricing overview page .
Ultimately, the tools you choose to work with will depend on the UX research methodologies you want to use, and on the scale of your research.
If you’re conducting small-scale research with just a few participants, you may not need an entire suite of tools with recruiting and analytics built in—a good survey tool and reliable video conferencing software should suffice.
But, if you’re conducting large-scale research with dozens or even hundreds of participants, and working as part of a team, you’ll want a set of UX research tools that are collaborative and versatile, covering everything from recruiting to synthesis and analysis.
You can mix and match your research tools, too: you might use Typeform for surveys, Lookback for user interviews, and Asana to collate all your findings. Before you settle on a specific tool, try it out with a free trial, read up on what other designers have said about their experience with the platform, and compare it to a few alternatives on the market.
Hopefully this guide has given you a good starting point from which to build out your UX research toolkit. If you’d like to learn more about UX tools, check out this complete guide to the best tools for every stage of the UX design process .
Subscribe to our newsletter
Get the best UX insights and career advice direct to your inbox each month.
Thanks for subscribing to our newsletter
You'll now get the best career advice, industry insights and UX community content, direct to your inbox every month.
Upcoming courses
Professional diploma in ux design.
Learn the full UX process, from research to design to prototyping.
Professional Certificate in UI Design
Master key concepts and techniques of UI design.
Certificate in Software and Coding Fundamentals for UX
Collaborate effectively with software developers.
Certificate in UX Design Fundamentals
Get a comprehensive introduction to UX design.
Professional Certificate in Content Design
Learn the skills you need to start a career in content design.
Professional Certificate in User Research
Master the research skills that make UX professionals so valuable.
Upcoming course
Build your UX career with a globally-recognised, industry-approved certification. Get the mindset, the skills and the confidence of UX designers.
You may also like
 design tools to try in 2024 12")
The 10 best user interface (UI) design tools to try in 2024

The 6 Best AI Tools for Content Design in 2024

AI for UX: 5 ways you can use AI to be a better UX designer
Build your UX career with a globally recognised, industry-approved qualification. Get the mindset, the confidence and the skills that make UX designers so valuable.
3 September 2024
New NPM integration: design with fully interactive components from top libraries!
Competitive Analysis for UX – Top 6 Research Methods

A UX competitive analysis is a crucial part of UX research . It’s an opportunity for designers to leverage what works, avoid what doesn’t, and identify gaps to gain a competitive advantage.
A UX competitor analysis can also help designers understand their users better. By looking at the competition through customers’ eyes, UX researchers can empathize better to discover what excites and frustrates them.
Get better results from user testing with UXPin’s advanced prototyping and testing tool . Design high-fidelity prototypes with code-like functionality that mimic your product’s user experience. Sign up for a free trial to explore all of UXPin’s advanced features.
Build advanced prototypes
Design better products with States, Variables, Auto Layout and more.

What is a UX Competitive Analysis?

A UX competitive analysis is a technique that UX researchers use to understand the competition, identify opportunities, and find an edge. This analysis provides UX design teams with valuable insights to develop a UX strategy and enhance a product’s user experience as well as business value.
A UX competitive analysis focuses primarily on design and interaction, but UX researchers also consider how business and other facets impact the overall user experience.
Why Should You Do a UX Competitive Analysis?
There are several reasons why you want to conduct a UX competitive analysis.
- Understand your market position and share
- Develop a UX strategy and prioritize the design process
- Discover how competitors solve similar usability issues
- Learn about failures and how to avoid them
- Determine competition strengths and weaknesses
- Learn about trends and innovation
- Support user and market research
What’s the Purpose of a UX Competitive Analysis?
A UX competitive analysis aims to complement other UX research to get a comprehensive picture of the market, competitors, products, and users. Here are several scenarios where designers conduct competitive analysis:
Building a new Product or Feature
UX competitor analysis is a crucial part of discovery-phase research. UX teams use this competitive analysis to understand the competitive landscape and find opportunities.
Identify Market Gaps
UX researchers can use competitive analysis to identify gaps and opportunities. These gaps could be product innovation or simply a better pricing structure.
Finding a gap in the market gives a company an edge over the competition, making their product more desirable.
Companies don’t always look for gaps; they often improve on (or steal) innovative competitor ideas. Facebook is renowned for copying the competition , while Twitter ended Clubhouse’s reign as the social audio platform with Spaces .
Support UX Research
Design teams also use a UX competitive analysis to confirm a hypothesis or support user research.
When Should You Do a UX Competitive Audit?

UX teams conduct a UX competitive analysis at the start of a new project during the early stages of the design process. As the competitive landscape and market change regularly, designers keep informed by conducting periodic competitor research.
Types of Competitors to Audit for UX
Competition falls into two categories:
- Direct competitors
- Indirect competitors
Understanding direct competitors can help improve your product and pricing to make your brand more desirable, while indirect competition could expose new opportunities.
Who are Direct competitors?
Direct competitors offer the same goods and services to the same or overlapping target market. These competitors generally compete on price because their offerings are so similar.
Instagram, TikTok, and Snapchat are direct competitors offering similar products to a similar target market.
Who are Indirect competitors?
Indirect competitors operate in the same market space but offer different products. While these are different products, they usually fulfill the same need, so the customer chooses one over another.
Instagram and LinkedIn are indirect competitors. While these platforms fulfill different needs, they both compete for user attention.
For example, many couples go out for dinner and a movie. A cinema with a restaurant in the foyer competes with other local cinemas (direct competitors) and restaurants (indirect competitors).
In tech, we often see indirect competitors with product overlaps. For example, Twitter and YouTube are indirect competitors, but the former offers video hosting for Tweets to keep users on the platform.
Before Twitter offered video hosting, users had to upload video content to their YouTube account and share the link in a Tweet. Nowadays, Twitter users don’t need a YouTube account to share video content, and you can embed Tweet videos in blog posts, resulting in less traffic for YouTube.
6 UX Competitive Analysis Research Methods
Here are six methods for analyzing the competition.
SWOT Analysis
SWOT (strengths, weaknesses, opportunities, and threats) is an analysis technique companies can use internally or against the competition. Companies can conduct a SWOT analysis on an entire industry, market, competitor, product range, or a single product.
A SWOT assesses four key areas:
- Strengths: Where is a competitor strongest? Areas where the competition makes it most difficult to compete.
- Weaknesses: Where is your competition weakest? What don’t they offer or do poorly? Pro tip: You can usually find this answer in your competitor’s 1-star reviews.
- Opportunities: What opportunities are open to your competition that they’re currently not exploiting? This opportunity could be a simple feature like one-click checkouts for an eCommerce brand to increase conversions.
- Threats: What could potentially harm your competitor’s business? These threats are usually external, like competition, legislation, politics, technology, etc.
This article from Investopedia provides a step-by-step guide to conducting a SWOT analysis.
Using a Competitor’s Product
One of the easiest ways to “spy” on your competition and gather data is using their products. For example:
- Firstly, what are your competitor’s touchpoints? What happens when you land on their website, download the app, read a blog article, etc.? How does the competition turn traffic into users and then paying customers?
- How does your competitor present its products and pricing to customers?
- What happens when you sign up for a free trial?
- How easy is it to upgrade? And more importantly, do they make it easy to cancel–what’s that process like?
- Analyze the overall UI design , including layout, microinteractions, colors, typography, etc.
- Use the product as a customer to complete tasks. Were there any pain points? What does your competitor do well and poorly?
Treat yourself as a usability participant by using an empathy map to record your feelings and emotions using your competitor’s product. Maybe you were confused and frustrated by an unclear pricing structure, or the intuitive UI and microinteractions made it fun to use the product.
Reading Competitors’ Reviews
Reviews from mobile app stores, social media (Facebook pages, Twitter mentions), marketplaces, and websites like TrustPilot are excellent resources for analyzing competitors (and also your product’s UX ). These customer reviews allow you to find out what customers love and hate about your competition.
Spend time analyzing reviews to find positive and negative patterns, and compare these patterns with your other research. Customers often leave comments like, “I wish the product could…” These types of reviews allow designers to identify gaps that competitors aren’t filling.
Comparison Chart
Comparison charts are best for direct competitors that offer similar product features. For example, you might want to compare a paid plan to your competitors to determine which company offers customers the most value.
This article from EdrawMax provides a breakdown of the five kinds of comparison charts and how to conduct one.
User Journey Comparison
User journeys map how customers complete tasks from start to end. Optimizing this end-to-end process can enhance the user experience and increase conversions.
Comparing your user journeys to successful competitors could uncover the keys to their secret to their success. For example, you might discover your competitors use fewer steps or strategic CTA placement to convert more customers.
Usability Test on a Competitor’s Prototype
One way to compare the competition is by building a prototype replica of their product or flow to see how users interact and engage with it. Designers can use these insights to revise their designs and make improvements.

The aim isn’t to copy your competition. Instead, you’re studying participants’ reactions and asking questions about which prototype they find more intuitive, attractive, and engaging.
Prototyping and Testing in UXPin
UXPin’s code-based design tool allows designers to build intuitive and engaging prototypes with user interfaces that look and function like the final product.
UXPin prototypes get actionable feedback from stakeholders and meaningful results from usability studies to improve the product and create the best user experience.
UXPin also enhances collaboration between design teams and engineers, resulting in less rework and smoother design handoffs . This enhanced workflow reduces time-to-market–an crucial metric in today’s competitive market.

Design systems are another way companies get an edge over the competition with better quality, consistency, and a faster time-to-market. UXPin allows startups and small businesses to build, manage, and scale a design system from scratch .
Designers can also use built-in design systems like Material Design, Bootstrap, iOS, and Foundation to prototype ideas fast!
Enhance your end-to-end design process and get an edge over the competition with the world’s most advanced code-based design tool. Sign up for a free trial and start designing better user experiences for your customers with UXPin.
Build prototypes that are as interactive as the end product. Try UXPin

by UXPin on 1st June, 2022
UXPin is a web-based design collaboration tool. We’re pleased to share our knowledge here.
UXPin is a product design platform used by the best designers on the planet. Let your team easily design, collaborate, and present from low-fidelity wireframes to fully-interactive prototypes.
No credit card required.
These e-Books might interest you

Design Systems & DesignOps in the Enterprise
Spot opportunities and challenges for increasing the impact of design systems and DesignOps in enterprises.

DesignOps Pillar: How We Work Together
Get tips on hiring, onboarding, and structuring a design team with insights from DesignOps leaders.
We use cookies to improve performance and enhance your experience. By using our website you agree to our use of cookies in accordance with our cookie policy.
Skip navigation
World Leaders in Research-Based User Experience
How to analyze qualitative data from ux research: thematic analysis.

August 17, 2022 2022-08-17
- Email article
- Share on LinkedIn
- Share on Twitter
Uncovering themes in qualitative data can be daunting and difficult. Summarizing a quantitative study is relatively clear: you scored 25% better than the competition, let’s say. But how do you summarize a collection of qualitative observations?
In the discovery phase , exploratory research is often carried out. This research often produces a lot of qualitative data, which can include:
Qualitative attitudinal data, such as people’s thoughts, beliefs and self-reported needs obtained from user interviews, focus groups and even diary studies
Qualitative behavioral data, such as observations about people’s behavior collected through contextual inquiry and other ethnographic approaches
Thematic analysis, which anyone can do, renders important aspects of qualitative data visible and makes uncovering themes easier.
In This Article:
What is a thematic analysis, challenges with analyzing qualitative data, tools and methods for conducting thematic analysis, steps to conduct a thematic analysis.
Definition: Thematic analysis is a systematic method of breaking down and organizing rich data from qualitative research by tagging individual observations and quotations with appropriate codes, to facilitate the discovery of significant themes.
As the name implies, a thematic analysis involves finding themes .
Definition: A theme :
- is a description of a belief, practice, need, or another phenomenon that is discovered from the data
- emerges when related findings appear multiple times across participants or data sources
Many researchers feel overwhelmed by qualitative data from exploratory research conducted in the early stages of a project. The table below highlights some common challenges and resulting issues.
| Qualitative research results in long transcripts and extensive field notes that can be time-consuming to read; you may have a hard time seeing patterns and remembering what’s important. | Analysis is often done very superficially, just skimming topics, focusing on only memorable events and quotes, and missing large sections of notes. |
| There are lots of detail within every sentence or paragraph. It can be hard to see which details are useful and which are superfluous. | The analysis simply becomes a regurgitation of what participants’ may have said or done, without any analytical thinking applied to it. |
| Sometimes the data from different participants or even from the same participant contains contradictions that researchers have to make sense of. | Analysis is not definitive because participant feedback is conflicting, or, worse, viewpoints that don't fit with the researcher's belief are ignored. |
| The aims of the initial data collection are lost because researchers can easily become too absorbed in the detail. | The analysis lacks focus and the research reports on the wrong thing. |
Without some form of systematic process, the problems outlined easily arise when analyzing qualitative data. Thematic analysis keeps researchers organized and focused and gives them a general process to follow when analyzing qualitative data.
A thematic analysis can be done in many different ways. The best tool or method for this process is determined based on the:
- context and constraints of the data-analysis phase
- the researcher’s personal style of work
3 common methods include:
- Using software
- Using affinity diagramming techniques
Using Software
Researchers often use data-analysis software for analyzing large amounts of qualitative data . Researchers upload their raw data (such as transcripts or field notes) into the software and then use the software’s features to code the data. Some tools even support transcription of the video or audio recordings. Examples of data-analysis software include:
- The analysis is very thorough.
- The analysis can be done collaboratively.
- The raw data and the results of the analysis are always accessible in the software and can be revisited when needed.
- The analysis can be time-consuming, as it results in many codes which need to be condensed into a small, manageable list.
- Subscriptions or licenses can be expensive
- Some learning of the software is required.
Writing thought processes and ideas you have about a text is common among researchers practicing grounded-theory methodology. Journaling as a form of thematic analysis is based on this methodology and involves manual annotation and highlighting of the data, followed by writing down the researchers’ ideas and thought processes. The notes are known as memos ( not to be confused with the office memo delivering news to employees).
- The process encourages reflection through the writing of detailed notes.
- Researchers have a record of how they arrived at their themes.
- The analysis is cheap and flexible.
- Hard to do collaboratively
Affinity-Diagramming Techniques
The data is highlighted, cut out physically or digitally, and reassembled into meaningful groups until themes emerge on a physical or digital board. (See a video demonstrating affinity-diagramming .)
- Can be done collaboratively
- Quick arriving at themes
- Cheap and flexible
- Visual, and supports an iterative-analysis process
- Not as thorough as other methods as often segments of text aren’t coded multiple times
- Hard to do when data is very varied, or there is a lot of data
Codes and Coding
All methods of thematic analysis assume some amount of coding (not to be confused with writing a program in a programming language).
Definition: A code is a word or phrase that acts as a label for a segment of text.
A code describes what the text is about and is a shorthand for more complicated information. (A good analogy is that a code describes data like a keyword describes an article or like a hashtag describes a tweet.) Often, qualitative researchers will not only have a name for each code but will also have a description of what the code means and examples of text that fit or don’t fit the code. These descriptions and examples are especially useful if more than one person is responsible for coding the data or if coding is done over a longer period of time.
Definition: Coding refers to the process of labeling segments of text with the appropriate codes.
Once codes are assigned, it’s easy to identify and compare segments of text that are about the same thing. The codes allow us to sort information easily and to analyze data to uncover similarities, differences, and relationships among segments. We can then arrive at an understanding of the essential themes.

Code Types: Descriptive and Interpretive
Codes can be:
- Descriptive: They describe what the data is about
- Interpretive: They are an analytical reading of the data, adding the researcher’s interpretive lens to it.
To see examples of descriptive and interpretive codes, let’s look at a quote from an interview I performed with a UX practitioner earlier this year (as part of our UX Careers research, to be published in our UX Careers report ).
“I was petrified about facilitating a meeting and my company offered a day-and-a-half– long course. So, I went in there and the instructor did something that I felt was horrible at the time, but I've since really come to appreciate it. The first thing that we did was we filled out a sheet of paper with our name and wrote down our worst fear of moderating or facilitating and we turned it in and then he said, okay, tomorrow you're going to act out this situation (…) the next day we came back and I would leave the room while the rest of the team read, they read my worst fear, figured out how they'd act it out, and then I'd walk in and facilitate for 10 minutes with that. And that really helped me realize that there isn't anything to be afraid of, that our fears are really in our head most of the time and facing that made me realize I can handle these situations.”
Here are possible descriptive and interpretive codes for the text above:
Descriptive code: how skills are acquired Rationale behind the code label: Participants were asked to describe how they came to possess certain skills.
Interpretive code: self-reflection Rationale behind the code label: The participant describes how this experience changed her beliefs about facilitation and how she reflected on her fear.
Regardless of which tool you use (software, journaling, or affinity diagraming), the act of conducting a thematic analysis can be broken down into 6 steps.

Step 1: Gather All Your Data
S tart with the raw data , such as interview or focus-group transcripts, field notes, or diary study entries. I recommended transcribing audio recordings from interviews and using the transcriptions for analysis instead of relying on patchy memory or notes.
Step 2: Read All Your Data from Beginning to End
Familiarize yourself with the data before you begin the analysis, even if you were the one to perform the research. Read all your transcripts, field notes, and other data sources before analyzing them. At this step, you can involve your team in the project. Involving your team instills knowledge of users and empathy for them and their needs .
Run a workshop (or a series of workshops if your team is very large or you have a lot of data). Follow these steps:
- Before your team members engage with the data, write your research questions on a whiteboard or piece of flipchart paper to make the questions easy to refer to while working.
- Give each member a transcript or one field- or diary-study entry. Tell people to highlight anything they think is important.
- Once team members have completed reading their entries, they can pass their transcript or entry to someone else and receive a new one from another team member. This step is repeated until all team members have engaged with all the data.
- Discuss as a group what you noticed or found surprising.

While it’s best if your team observes all your research sessions, that may not be possible if you have a lot of sessions or a big team. When individual team members observe only a handful of sessions, they sometimes walk away with an incomplete understanding of the findings. The workshop can solve that problem, since everyone will read all the session transcripts.
Step 3: Code the Text Based on What It’s About
In the coding step, highlighted sections need to be categorized so that the highlighted sections can be easily compared.
At this stage, remind yourself of your research objectives. Print your research questions out. Stick them up on a wall or on a whiteboard in the room where you’re conducting the analysis.
If you have adequate time, you can involve your team in this initial coding step. If time is limited and there is a lot of data to work through, then do this step by yourself and invite your team later to review your codes and help flesh out the themes.
As you are coding, review each segment of text and ask yourself “ What is this about?” Give the fragment a name that describes the data (a descriptive code). You can also add interpretive codes to the text at this stage. However, these will typically become easier to assign later.
The code can be created before or after you have grouped the data . The next two sections of this step describe how and when you may add the codes.
Traditional Method: Create Codes Before Grouping
In the traditional approach, as you highlight segments of the data, like sentences, paragraphs, phrases, you code them. It’s helpful to keep a record of all the codes used and outline what they are, so you can refer to this list when coding further sections of the text (especially if multiple people are coding the text). This approach avoids creating multiple codes (that will later need to be consolidated) for the same type of issue.
Once all the text has been coded, you can group all the data that has the same code.
If you’re using software for this process, then it will automatically log the codes you assign while coding, so you can use them again. It will then provide a way for you to view all text coded with the same code.

Quick Method: Group Segments of Text, Then Assign a Code
Rather than coming up with a code when you highlight text, you cut up (physically or digitally) and cluster all the similar highlighted segments (similarly to how different stickies may be grouped in an affinity map ). The groupings are then given a code. If you’re doing the clustering digitally, you might pull coded sections into a new document or a visual collaboration platform.
In the pictures below, the grouping was done manually. Transcripts were cut up, fixed to stickies, and moved around the board until they fell into natural topic groups. The researcher then assigned a pink sticky with a descriptive code to the grouping.

At the end of this step, you should have data grouped by topics and codes for each topic.
Let’s look at an example. I interviewed 3 people about their experience of cooking at home. In these interviews, participants talked about how they chose to cook certain things and not others. They talked about specific challenges they faced while cooking (e.g., dietary requirements, tight budgets, lack of time and physical space) and about solutions for some of these challenges.
After grouping the highlighted clippings from my interviews by topic, I ended up with 3 broad descriptive codes and corresponding groupings:
- Cooking experiences : memorable positive and negative experiences related to cooking
- Pain points : anything that stops someone from cooking or makes cooking difficult (including navigating dietary restrictions, limited budgets, etc.)
- Things that help: what helps (or is believed to possibly help) someone overcome specific challenges or pain points
Step 4: Create New Codes that Encapsulate Potential Themes
Look across all the codes and explore any causal relationships, similarities, differences, or contradictions to see if you can uncover underlying themes. While doing so, some of the codes will be set aside (either archived or deleted) and new interpretive codes will be created. If you’re using a physical-mapping approach like that discussed in step 3, then some of these initial groupings may collapse or expand as you look for themes.
Ask yourself the following questions:
- What’s going on in each group?
- How are these codes related?
- How do these relate to my research questions?
Returning to our cooking topic, when analyzing the text within each grouping and looking for relationships between the data, I noticed that two participants said that they liked ingredients that can be prepared in different ways and go well with other different ingredients. A third participant talked about wishing she could have a set of ingredients that can be used for many different meals throughout the week, rather than having to buy separate ingredients for each meal plan. Thus, a new theme about the flexibility of ingredients emerged. For this theme, I came up with the code one ingredient fits all, for which I then wrote a detailed description.

Step 5: Take a Break for a Day, then Return to the Data
It almost always is a good idea to take a break and come back and look at the data with a fresh pair of eyes. Doing so sometimes helps you to see significant patterns in the data clearly and derive breakthrough insights.
Step 6: Evaluate Your Themes for Good Fit
In this step, it can be useful to have others involved to help you review your codes and emerging themes. Not only are new insights drawn out, but your conclusions can be challenged and critiqued by fresh eyes and brains. This practice reduces the potential for your interpretation to be colored by personal biases.
Put your themes under scrutiny. Ask yourself these questions:
- Is the theme well supported by the data? Or could you find data that don’t support your theme?
- Is the theme saturated with lots of instances?
- Do others agree with the themes you have found in the data after analyzing the data separately?
If the answer to these questions is no , it might mean that you need to return to the analysis board. Assuming you collected sound data, there is almost always something to be learned, so spending more time with your team repeating steps 4–6 will be worthwhile.
A thematic analysis can uncover the major themes from your research. There’s no one way to do a thematic analysis. Choose a method of analysis that suits the kind and volume of data you’ve collected. When possible, invite others into the analysis process to both increases the accuracy of the analysis and your team’s knowledge of your users’ behaviors, motivations, and needs. Analysis can be a lengthy process, so a good rule of thumb is to budget at least as much time as you had for the data collection to complete the analysis.
Learn more: User Interviews , a full-day course.
Related Courses
User interviews.
Uncover in-depth, accurate insights about your users
ResearchOps: Scaling User Research
Orchestrate and optimize research to amplify its impact
Survey Design and Execution
Use surveys to drive and evaluate UX design
Related Topics
- Research Methods Research Methods
Learn More:
Please accept marketing cookies to view the embedded video. https://www.youtube.com/watch?v=KUZ6iGvJlGI
Thematic Analysis of Qualitative User Research Data

What Is a SWOT Analysis?
Therese Fessenden · 5 min

What Is User Research?
Caleb Sponheim · 3 min

Competitive Reviews vs. Competitive Research
Therese Fessenden · 4 min
Related Articles:
Should You Run a Survey?
Maddie Brown · 6 min
Open-Ended vs. Closed Questions in User Research
Maria Rosala · 5 min
When to Use Which User-Experience Research Methods
Christian Rohrer · 9 min
Between-Subjects vs. Within-Subjects Study Design
Raluca Budiu · 8 min
UX Research Methods: Glossary
Raluca Budiu · 12 min
Card Sorting: Pushing Users Beyond Terminology Matches
Samhita Tankala and Jakob Nielsen · 5 min
- Reviews / Why join our community?
- For companies
- Frequently asked questions
UX Research
What is ux research.
UX (user experience) research is the systematic study of target users and their requirements, to add realistic contexts and insights to design processes. UX researchers adopt various methods to uncover problems and design opportunities. Doing so, they reveal valuable information which can be fed into the design process.
See why UX research is a critical part of the UX design process.
- Transcript loading…
UX Research is about Finding Insights to Guide Successful Designs
When you do UX research, you’ll be better able to give users the best solutions—because you can discover exactly what they need. You can apply UX research at any stage of the design process. UX researchers often begin with qualitative measures, to determine users’ motivations and needs . Later, they might use quantitative measures to test their results . To do UX research well, you must take a structured approach when you gather data from your users. It’s vital to use methods that 1) are right for the purpose of your research and 2) will give you the clearest information. Then, you can interpret your findings so you can build valuable insights into your design .
“I get very uncomfortable when someone makes a design decision without customer contact.” – Dan Ritzenthaler, Senior Product Designer at HubSpot
We can divide UX research into two subsets:
Qualitative research – Using methods such as interviews and ethnographic field studies, you work to get an in-depth understanding of why users do what they do (e.g., why they missed a call to action, why they feel how they do about a website). For example, you can do user interviews with a small number of users and ask open-ended questions to get personal insights into their exercise habits. Another aspect of qualitative research is usability testing , to monitor (e.g.) users’ stress responses. You should do qualitative research carefully. As it involves collecting non-numerical data (e.g., opinions, motivations), there’s a risk that your personal opinions will influence findings.
Quantitative research – Using more-structured methods (e.g., surveys, analytics), you gather measurable data about what users do and test assumptions you drew from qualitative research. For example, you can give users an online survey to answer questions about their exercise habits (e.g., “How many hours do you work out per week?”). With this data, you can discover patterns among a large user group. If you have a large enough sample of representative test users, you’ll have a more statistically reliable way of assessing the population of target users. Whatever the method, with careful research design you can gather objective data that’s unbiased by your presence, personality or assumptions. However, quantitative data alone can’t reveal deeper human insights.
We can additionally divide UX research into two approaches:
Attitudinal – you listen to what users say—e.g., in interviews.
Behavioral – you see what users do through observational studies.
When you use a mix of both quantitative and qualitative research as well as a mix of attitudinal and behavioral approaches, you can usually get the clearest view of a design problem.

© Interaction Design Foundation, CC BY-SA 4.0
Use UX Research Methods throughout Development
The Nielsen Norman Group—an industry-leading UX consulting organization—identifies appropriate UX research methods which you can use during a project’s four stages . Key methods are:
Discover – Determine what is relevant for users.
Contextual inquiries – Interview suitable users in their own environment to see how they perform the task/s in question.
Diary studies – Have users record their daily interactions with a design or log their performance of activities.
Explore – Examine how to address all users’ needs.
Card sorting – Write words and phrases on cards; then let participants organize them in the most meaningful way and label categories to ensure that your design is structured in a logical way.
Customer journey maps – Create user journeys to expose potential pitfalls and crucial moments.
Test – Evaluate your designs.
Usability testing – Ensure your design is easy to use.
Accessibility evaluations – Test your design to ensure it’s accessible to everyone.
Listen – Put issues in perspective, find any new problems and notice trends.
Surveys/Questionnaires – Use these to track how users’ feel about your product.
Analytics – Collect analytics/metrics to chart (e.g.) website traffic and build reports.
- Copyright holder: Unsplash. Copyright terms and license: CCO Public Domain. Link: https://pixabay.com/en/clay-hands-sculpting-art-69...
- Copyright holder: Unsplash. Copyright terms and license: CCO Public Domain. Link: https://www.pexels.com/photo/man-in-black-shirt-an...
- Copyright holder: Indecent Proposer. Copyright terms and license: CC BY-NC 2.0 Link: https://www.flickr.com/photos/indecent_proposal/14...
- Copyright holder: Anna Langova. Copyright terms and license: CC0 1.0 Link: http://www.publicdomainpictures.net/view-image.php...
- Copyright holder: Conmongt. Copyright terms and license: CC0 Public Domain Link: https://pixabay.com/en/hourglass-time-time-lapse-clock-1623517/
Whichever UX research method you choose, you need to consider the pros and cons of the different techniques . For instance, card sorting is cheap and easy, but you may find it time-consuming when it comes to analysis. Also, it might not give you in-depth contextual meaning. Another constraint is your available resources , which will dictate when, how much and which type of UX research you can do. So, decide carefully on the most relevant method/s for your research . Moreover, involve stakeholders from your organization early on . They can reveal valuable UX insights and help keep your research in line with business goals. Remember, a design team values UX research as a way to validate its assumptions about users in the field , slash the cost of the best deliverables and keep products in high demand —ahead of competitors’.

User research methods have different pros and cons,and vary from observations of users in context to controlled experiments in lab settings.
Learn More about UX Research
For a thorough grasp of UX research, take our course here: User Research – Methods and Best Practices
Read an extensive range of UX research considerations, discussed in Smashing Magazine: A Comprehensive Guide To UX Research
See the Nielsen Norman Group’s list of UX research tips: UX Research Cheat Sheet
Here’s a handy, example-rich catalog of UX research tools: 43 UX research tools for optimizing your product
Questions related to UX Research
UX research is a good career for those who enjoy working with a team and have strong communication skills. As a researcher, you play a crucial role in helping your team understand users and deliver valuable and delightful experiences. You will find a UX research career appealing if you enjoy scientific and creative pursuits.
Start exploring this career option; see the User Researcher Learning Path .
Studies suggest that companies are also willing to pay well for research roles. The average salary for a UX researcher ranges from $92,000 to $146,000 per year.
In smaller companies, user research may be one of the responsibilities of a generalist UX designer. How much can your salary vary based on your region? Find out in UI & UX Designer Salaries: How Much Can I Earn .
Research is one part of the overall UX design process. UX research helps inform the design strategy and decisions made at every step of the design process. In smaller teams, a generalist designer may end up conducting research.
A UX researcher aims to understand users and their needs. A UX designer seeks to create a product that meets those needs.
A UX researcher gathers information. A UX designer uses that information to create a user-friendly and visually appealing product.
Learn more about the relationship between UX research and UX design in the course:
User Experience: The Beginner’s Guide
If we consider a very broad definition of UX, then all user research is UX research.
However, in practice, there is a subtle difference between user research and UX research. While both involve understanding people, user research can involve users in any kind of research question, and some questions may not be that directly connected to user experience.
For example, you might do user research relating to a customer’s experience in relation to pricing, delivery or the experience across multiple channels.
Common UX research methods are usability testing, A/B testing, surveys, card sorting, user interviews, usage analytics and ethnographic research. Each method has its pros and cons and is useful in different scenarios. Hence, you must select the appropriate research method for the research question and target audience. Learn more about these methods in 7 Great, Tried and Tested UX Research Techniques .
Get started with user research. Download the User Research template bundle .

For a deep dive into usability testing—the most common research method, take the course Conducting Usability Testing .
Having a degree in a related field can give you an advantage. However, you don’t need a specific degree to become a UX researcher. A combination of relevant education, practical experience, and continuous learning can help you pursue a career in UX research. Many UX researchers come from diverse educational backgrounds, including psychology, statistics, human-computer interaction, information systems, design and anthropology.
Some employers may prefer candidates with at least a bachelor’s degree. However, it does not have to be in a UX-related field. There are relatively fewer degrees that focus solely on user research.
Data-Driven Design: Quantitative Research for UX
User Research – Methods and Best Practices
Every research project will vary. However, there are some common steps in conducting research, no matter which method or tool you decide to use:
Define the research question
Select the appropriate research method
Recruit participants
Conduct the research
Analyze the data
Present the findings
You can choose from various UX research tools . Your choice depends on your research question, how you're researching, the size of your organization, and your project. For instance:
Survey tools such as Typeform and Google Forms.
Card sorting tools such as Maze and UXtweak.
Heatmap tools such as HotJar and CrazyEgg
Usability testing (through first-click testing and tree-testing) tools such as Optimal Workshop and Loop 11
Diagramming applications such as Miro and Whimsical to analyze qualitative data through affinity diagramming.
Spreadsheet tools such as Google Sheets and Microsoft Excel for quantitative data analysis
Interface design and prototyping tools like Figma, Adobe XD, Sketch and Marvel to conduct usability testing.
Presentation tools such as Keynote, Google Slides and Microsoft PowerPoint.
Many of these tools offer additional features you can leverage for multiple purposes. To understand how you can make the most of these tools, we recommend these courses:
There are relatively fewer degrees that focus solely on user research.
While there are no universal research case study formats, here’s one suggested outline:
An overview of the project: Include the problem statement, goals and objectives.
The research methods and methodology: For example, surveys, interviews, or usability testing).
Research findings
The design process: How the research findings led to design decisions.
Impact of design decisions on users and the business: Include metrics such as conversion and error rates to demonstrate the impact.
Optionally, include notes on what you learned and how you can improve the process in the future.
Learn how to showcase your portfolio to wow your future employer/client in the How to Create a UX Portfolio course.
While AI can help automate tasks and help UX researchers, it will not completely replace them. AI lacks the creativity and empathy that human designers bring to the table.
Human researchers are better at understanding the nuances of human behavior and emotions. They can also think outside the box and develop creative solutions that AI cannot. So, AI can help researchers be more efficient and effective through data analysis, smart suggestions and automation. But it cannot replace them.
Watch AI-Powered UX Design: How to Elevate Your UX Career to learn how you can work with AI.
Agile teams often struggle to incorporate user research in their workflows due to the time pressure of short sprints. However, that doesn’t mean agile teams can’t conduct research. Instead of seeing research as one big project, teams can break it into bite-sized chunks. Researchers regularly conduct research and share their findings in every sprint.
Researchers can involve engineers and other stakeholders in decision-making to give everyone the context they need to make better decisions. When engineers participate in the decision-making process, they can ensure that the design will be technically feasible. There will also be lower chances of errors when the team actually builds the feature. Here’s more on how to make research a team effort .
For more on bite-sized research, see this Master Class: Continuous Product Discovery: The What and Why
For more practical tips and methods to work in an agile environment, take our Agile Methods for UX Design course.
User research is very important in designing products people will want and use. It helps us avoid designing based on what we think instead of what users actually want.
UX research helps designers understand their users’ needs, behaviors, attitudes and how they interact with a product or service. Research helps identify usability problems, gather feedback on design concepts, and validate design decisions. This ultimately benefits businesses by improving the product, brand reputation and loyalty. A good user experience provides a competitive edge and reduces the risk of product failure.
Learn more about the importance of user research in the design process in these courses:
Design Thinking: The Ultimate Guide
Answer a Short Quiz to Earn a Gift
What is the primary purpose of UX research in design processes?
- To ensure the product is visually appealing.
- To reduce the cost of marketing the product.
- To understand user needs and enhance design decisions.
Which type of UX research do designers use to collect non-numerical data such as opinions and motivations?
- Behavioral research
- Qualitative research
- Quantitative research
Which UX research method involves users sorting terms into categories to help structure design logically?
- Card sorting
- Information architecture
- Usability testing
What is a potential drawback of using card sorting in UX research?
- It can be expensive and requires special software.
- It may not provide deep contextual insights.
- It only works for digital products.
How does UX research primarily benefit a design team in a business context?
- It focuses exclusively on the aesthetic aspects of product design.
- It reduces dependency on technology.
- It validates design assumptions and keeps products competitive.
Better luck next time!
Do you want to improve your UX / UI Design skills? Join us now
Congratulations! You did amazing
You earned your gift with a perfect score! Let us send it to you.
Check Your Inbox
We’ve emailed your gift to [email protected] .
Literature on UX Research
Here’s the entire UX literature on UX Research by the Interaction Design Foundation, collated in one place:
Learn more about UX Research
Take a deep dive into UX Research with our course User Research – Methods and Best Practices .
How do you plan to design a product or service that your users will love , if you don't know what they want in the first place? As a user experience designer, you shouldn't leave it to chance to design something outstanding; you should make the effort to understand your users and build on that knowledge from the outset. User research is the way to do this, and it can therefore be thought of as the largest part of user experience design .
In fact, user research is often the first step of a UX design process—after all, you cannot begin to design a product or service without first understanding what your users want! As you gain the skills required, and learn about the best practices in user research, you’ll get first-hand knowledge of your users and be able to design the optimal product—one that’s truly relevant for your users and, subsequently, outperforms your competitors’ .
This course will give you insights into the most essential qualitative research methods around and will teach you how to put them into practice in your design work. You’ll also have the opportunity to embark on three practical projects where you can apply what you’ve learned to carry out user research in the real world . You’ll learn details about how to plan user research projects and fit them into your own work processes in a way that maximizes the impact your research can have on your designs. On top of that, you’ll gain practice with different methods that will help you analyze the results of your research and communicate your findings to your clients and stakeholders—workshops, user journeys and personas, just to name a few!
By the end of the course, you’ll have not only a Course Certificate but also three case studies to add to your portfolio. And remember, a portfolio with engaging case studies is invaluable if you are looking to break into a career in UX design or user research!
We believe you should learn from the best, so we’ve gathered a team of experts to help teach this course alongside our own course instructors. That means you’ll meet a new instructor in each of the lessons on research methods who is an expert in their field—we hope you enjoy what they have in store for you!
All open-source articles on UX Research
7 great, tried and tested ux research techniques.

- 1.2k shares
- 3 years ago
The Ultimate Guide to Understanding UX Roles and Which One You Should Go For

- 10 mths ago
Shadowing in User Research - Do You See What They See?

Contextual Interviews and How to Handle Them

15 Guiding Principles for UX Researchers

Ethnography

Porter’s 5 Forces Model - Design in Context, Understand the Market

- 7 years ago
Ideas for Conducting UX Research with Children

Laddering Questions Drilling Down Deep and Moving Sideways in UX Research

- 8 years ago
Action Research
The top ux design books you need to read in 2024: beginner to expert.

4 Common Pitfalls in Usability Testing and How to Avoid Them to Get More Honest Feedback

- 2 years ago
Confirmation Bias – It’s Not What We Think We Know That Counts

User Research Methods for Mobile UX

6 Tips for Better International UX Research

Common UX Research Interview Questions

Collaborating with Your Team for Research

The Best Free UX Design Courses in 2024

Adding Quality to Your Design Research with an SSQS Checklist

How to Fit Quantitative Research into the Project Lifecycle

Open Access—Link to us!
We believe in Open Access and the democratization of knowledge . Unfortunately, world-class educational materials such as this page are normally hidden behind paywalls or in expensive textbooks.
If you want this to change , cite this page , link to us, or join us to help us democratize design knowledge !
Privacy Settings
Our digital services use necessary tracking technologies, including third-party cookies, for security, functionality, and to uphold user rights. Optional cookies offer enhanced features, and analytics.
Experience the full potential of our site that remembers your preferences and supports secure sign-in.
Governs the storage of data necessary for maintaining website security, user authentication, and fraud prevention mechanisms.
Enhanced Functionality
Saves your settings and preferences, like your location, for a more personalized experience.
Referral Program
We use cookies to enable our referral program, giving you and your friends discounts.
Error Reporting
We share user ID with Bugsnag and NewRelic to help us track errors and fix issues.
Optimize your experience by allowing us to monitor site usage. You’ll enjoy a smoother, more personalized journey without compromising your privacy.
Analytics Storage
Collects anonymous data on how you navigate and interact, helping us make informed improvements.
Differentiates real visitors from automated bots, ensuring accurate usage data and improving your website experience.
Lets us tailor your digital ads to match your interests, making them more relevant and useful to you.
Advertising Storage
Stores information for better-targeted advertising, enhancing your online ad experience.
Personalization Storage
Permits storing data to personalize content and ads across Google services based on user behavior, enhancing overall user experience.
Advertising Personalization
Allows for content and ad personalization across Google services based on user behavior. This consent enhances user experiences.
Enables personalizing ads based on user data and interactions, allowing for more relevant advertising experiences across Google services.
Receive more relevant advertisements by sharing your interests and behavior with our trusted advertising partners.
Enables better ad targeting and measurement on Meta platforms, making ads you see more relevant.
Allows for improved ad effectiveness and measurement through Meta’s Conversions API, ensuring privacy-compliant data sharing.
LinkedIn Insights
Tracks conversions, retargeting, and web analytics for LinkedIn ad campaigns, enhancing ad relevance and performance.
LinkedIn CAPI
Enhances LinkedIn advertising through server-side event tracking, offering more accurate measurement and personalization.
Google Ads Tag
Tracks ad performance and user engagement, helping deliver ads that are most useful to you.
Share Knowledge, Get Respect!
or copy link
Cite according to academic standards
Simply copy and paste the text below into your bibliographic reference list, onto your blog, or anywhere else. You can also just hyperlink to this page.
New to UX Design? We’re Giving You a Free ebook!

Download our free ebook The Basics of User Experience Design to learn about core concepts of UX design.
In 9 chapters, we’ll cover: conducting user interviews, design thinking, interaction design, mobile UX design, usability, UX research, and many more!
- Research + Insights
- UX Research
- UX Research Methods and Techniques [2024 Guide]
UX Research Methods and Techniques
Explore 16 of the most common quantitative and qualitative methods for making informed decisions and generating actionable human insights
Introduction to UX Research Methods
What are ux research methods.
UX research methods are the family of experimental protocols design teams use to study users and test prototypes. They include everything from simple interviews to specialized scorecards, and can be either moderated (ex. interviews) or unmoderated (ex. surveys).
While conducting UX research should generally be left to experienced designers, every member of a Design Thinking team can benefit from a deeper appreciation of the established techniques and rich insights they provide.
What are the types of UX Research methods?
For the sake of simplicity, this guide categorizes common UX research methods into three types based on the data they commonly provide: Quantitative, Qualitative, or Mixed.
Quantitative UX Research Methods Best for benchmarking, prioritization and forecasting
Qualitative UX Research Methods Best for modelling user experiences and inspiring ideas
Mixed UX Research Methods Can be used to deliver both quantitative and qualitative data
The UX Research Methods Matrix
X-dimension: situation vs solution.
The X-dimension separates methods based on what they are typically used to study: Either the situation as a whole (like a literature review or diary study), or the solution being created (like concept testing or an intercept survey). UX research methods are leveraged throughout the complete project cycle — they don’t end when the interviews are over.
| Studying the Situation | Studying the Solution |
|---|---|
| Studies the context of the solution | Studies the solution in context |
| Identifies opportunities and constraints | Prioritizes ideas and produces benchmarks |
| Used to create a current landscape | Used to refine working prototypes |
| Ex: Literature reviews, diary studies | Ex: Concept testing, usability testing |
Y-Dimension: Qualitative vs Quantitative
The Y-dimension separates methods based on the type of data they typically output: Either more qualitative (like focus groups or concept testing), or more quantitative (like user surveys or A/B testing). Relying on only one type of data can be dangerous: Robust research projects should include a mix of both, as they provide different perspectives on the experience.
| More Quantitative | More Qualitative |
|---|---|
| Assesses the quality of an experience | Assesses the quantity of an experience |
| Identifies needs and inspires solutions | Identifies patterns and informs KPIs |
| Most used during Observation and Iterate | Most used during Explore and Verify |
| Ex: User interviews, heuristic evaluation | Ex: User surveys, behavioral analytics |
Which UX Research Methods should I use?
Typically, UX research methods are stacked together to create an overall UX research plan . That means that the selection of your methods is based on what stage of the plan you are in, and what questions you need to answer. Keep the following factors in mind as you browse the guide:
Three factors to consider when selecting a research method
- Questions: What do we need to find out specifically?
- Resources: How much time/talent/budget do we have?
- Risk tolerance: What are the risks of incorrect assumptions?
If it doesn’t agree with experiment, it’s wrong.
Qualitative UX Research Methods
Qualitative UX Research Methods are powerful sources of inspiration. They bring the voice of the customer directly into the design process, and answer critical questions about the goals and behaviors that solutions can support.
UX research methods in this section:
- User interviews
- Focus groups
- Diary studies
- Literature review
- Participatory design
- Remote walkthrough
User Interviews

User Interviews are the bread and butter of qualitative UX research methods. When designing user-centered solutions, there is no substitute for speaking with real users. While user interviews can take many forms and can integrate multiple methods (such as card sorting and concept testing), the quality of any interview is determined by the quality of its questions.
When planning user interviews, extreme care must be taken to develop questions that are most likely to make interviewees comfortable and actively engaged. If you have ever conducted user interviews before, you will appreciate how difficult this can be in formal settings.
| Closed-ended question (Avoid) | Open-ended question (Encourage) |
|---|---|
| Do you do this task/action often? | Why do you do this task/action? |
| Is your job difficult? | What makes your job more/less difficult? |
| Are there people supporting you? | When do you turn to others for help? |
User interviews help to answer
- Who are our primary and secondary personas?
- What do they think and do? Say and feel?
- What are their major pains and gains?
- Who else should we be talking to?
Focus Groups
Focus groups are like user interviews conducted with a group of 5-10 people at once. While they can help expedite the research process , they require significant planning and expert moderation to conduct effectively. Because of this, focus groups are typically conducted by research firms experienced at building group discussion guides that balance personalities and ensure all participants are able to share their feelings openly and evenly.
Focus groups help to answer
- What do teams think about a topic/solution?
- What information gaps exist in the field?
- Which disciplines should we be talking to?
- Does our messaging spark controversy? Conversation?
Diary Studies
Diary studies are an ethnographic UX research method that provide rich qualitative insights. The basic premise of a diary study is to ask potential users to record their experiences in a diary, which is then collected by researchers upon completion.
Diary studies can be recorded as guided journal entries or photo essays, and typically aim to describe a “ day in the life ” of a particular person. Diary studies add a level of realism that can’t be achieved in controlled settings, and are a great way to gain the type of detailed insights that inspire genuine innovations. Note that due to their revealing nature, protecting user privacy is especially important to consider with this method.
Diary studies help to answer
- What does a typical day look like?
- Who do our users rely on and when?
- When/where do our users engage with us?
- What other factors influence the experience?
Literature Review
Also called secondary or desk research, Literature Reviews are a method for exploring available information to gain context about a specific domain. While the rigor required varies with every solution, every design project is likely to benefit from at least a cursory review of existing research. When conducting literature reviews, it is critical to consider the credibility and bias of the source. Government statistics and peer-reviewed publications are typically the most robust sources, with surveys, articles and other sources requiring additional caution.
Literature reviews help to answer
- What cultural trends are influencing our users?
- How has our demographic evolved over time?
- What does science say about the unmet need?
- How are other related solutions experienced?
- What else do we know about our users?
Participatory Design
Participatory design is when teams integrate one or more users directly into their design process. This can be particularly helpful when designing enterprise solutions for specific roles, where deep domain knowledge is needed to appreciate the complexities of required tasks. It also helps to create external “champions” of the solution, who will then help train users and improve adoption.
While the benefit of having instant access to real user feedback can help remove bias and align teams, it is not without risks. The power of user personas is that they represent the collective goals and behaviors of target groups. Relying on n=1 comes with risks.
Participatory design helps to answer
- What would the user do/think?
- What challenges a decision cause?
- Which feature is most important?
- How do these experiences compare?
Remote Walkthrough

A remote walkthrough, also called a Touchstone Tour or simply “shadowing”, puts users in the driver seat as they walk design teams through their environment. For example, if you were designing a new video editing application, you may recruit current video editors to walk you through their daily tasks within the software. Thanks to modern video conferencing tools like Slack or Zoom, it’s easy to conduct and record remote walkthroughs alongside other ux research methods.
Remote walkthroughs help to answer
- What tasks are required to complete their goals?
- How do users complete these tasks?
- What UX challenges do they face along the way?
- Do they use any shortcuts? Customizations?
- How comfortable are users in their environment?
Quantitative UX Research Methods
Today, digital “desire lines” are everywhere — but only if you know where to look. Whether you are improving an app used by millions, or building a service for select specialists, being able to parse big data into actionable insights is a mandatory skill for all UX researchers.
- Behavioral analytics
- User surveys
- Intercept surveys
- Click tracking
- Eye tracking
- A/B testing
Behavioral Analytics
Behavioral analytics help model how users are engaging with an existing system or solution. The process of determining which metrics are the best proxy for the experience, and what the current data says about the solution, is where this UX research method shines.
Typically, the analysis is completed by a core research team and shared with the broader cross functional team during design thinking workshops to inform and inspire ideas. Common behavioral metrics include bounce rate, conversion rate, time to completion, time on task, or other digital/physical desire lines.
Behavioral analytics help to answer
- Where are our users coming from?
- Are they finding what they want?
- How long are they spending with us?
- What do they search for most?
- How often do they engage with us?
User Surveys
Surveys are an established research method adopted by myriad disciplines to collect hard data from groups of people. Data are then analyzed by statistical methods to generate “significant” insights that are unlikely to be due to chance. The power to discern signal from noise is the product of the size of the survey sample: The more people you ask, the more confident the statistics will be.
Like user interviews, the quality of a user survey relies on recruiting the right people and asking the right questions. But unlike interviews, these questions need to be formatted in a way that can be answered using a sliding scale or multiple choice — at least until natural language processing simplifies the analysis of free-text responses.
User surveys help to answer
- Who are our users?
- What challenges do they face?
- What goals and behaviors do they share?
- Where should we focus our design efforts?
- What do they think about a situation or solution?
Intercept Surveys

Intercept surveys, also called feedback surveys, are a simplified form of user survey deployed in the wild where interactions occur. Intercept surveys are commonly found on websites and in emails, and can be as simple as asking “Was this information helpful?”. In practice, intercept surveys are best when limited to only a single question that is easy to understand and effortless to answer.
Intercept surveys help to answer
- What are the biggest challenges users face?
- Where does the experience go wrong?
- Why are users dropping off at this point?
- How is our current solution being received?
Click Tracking
Click Tracking is a specialized ux research method that lets designers observe and analyze everywhere users click or tap when visiting a website. While digital marketers have been using scroll depth and CTA conversion rates for years, modern click-tracking tools like HotJar can now passively record real user visits and generate cumulative heat maps for your pages. These heat maps show where users are (and aren’t) clicking. In fact, HotJar will automatically generate three different layers of heat maps to capture all clicks, moves and scrolls. Together, these session-tracking maps help designers present findings to stakeholders and improve on-page conversions.
Click tracking helps to answer
- Is this button/content getting lost?
- Are users trying to click the wrong thing?
- How are users engaging with our pages?
- What effect did this design update have?
Eye Tracking
Eye tracking is a specialized UX research method that records where your test users are looking — not just where they scroll or click to. Unlike click tracking which can be installed on a live website, eye tracking studies require controlled settings with user opt-in. In the past, eye tracking was prohibitively expensive due to the technology required; however, accurate, webcam-based tools like Real Eye have greatly reduced the barrier to entry.
Today, eye tracking studies are frequently used as a form of unmoderated usability testing that participants can complete on their own time. This dramatically simplifies the logistics and reduces the guesswork in major decision decisions.
Eye tracking helps to answer
- Where do users look first?
- What design is more attractive?
- Is our message being missed?
- Are we confusing our users?
A/B Testing
A/B Testing is a data-driven way to determine which of two (or more) options is the most effective at achieving a specific goal. A/B testing is used in a variety of industries, especially in digital marketing, where optimizing conversion rates is of critical importance. In user experience design , A/B testing can be used to optimize specific aspects of an existing solution, or to determine which of two designs to pursue.
A/B testing helps to answer
- What experience converts best?
- How can we optimize the experience?
- What direction should we pursue?
- What do our users prefer?
Mixed UX Research Methods
Mixed UX Research methods can be used to generate human insights and hard data . They allow for both direct observation of user behaviors, while also generating data that can be subject to statistical analysis.
UX research methods described in this section:
- Heuristic evaluation
- Concept testing
- Tree testing
- Card sorting
- Usability testing
Heuristic Evaluation
Heuristic evaluation is effectively a “pragmatic review” of a user experience by design experts. When applied formally, it uses a point-based scoring system akin to those used to judge athletic performances (like gymnastics or diving). Using predefined criteria and scorecards helps to reduce bias and make scalable decisions in situations where direct usability testing is not possible or necessary.
Of course, the quality of a heuristic evaluation is determined by the experience of the reviewers, and their ability to make unbiased judgements from a user’s point of view. Having a validated set of personas helps improve the output of a heuristic evaluation, and the same interfaces can (and should) be reviewed from the perspective of multiple user personas.
Web users ultimately want to get at data quickly and easily.
Heuristic evaluation helps to answer
- Which design is more user friendly?
- How much have we improved our UX?
- Do we need to redesign this solution?
- What quick wins can we start with?
Concept Testing
Concept testing is exactly that: Testing concepts/prototypes with users to see what they say. Concept testing is common when developing marketing campaigns or other mass-market creative ideas where it is difficult or impossible to predict how people will respond. Concept testing and usability testing are quite similar in this sense; however, concept testing is concerned with deciding which concept (or “big idea”) to pursue, while usability testing is conducted with high-fidelity designs to validate decisions or make minor improvements. Concept testing is commonly integrated with other techniques to streamline the research efforts, and can use card sorting and scorecards to support data-informed decisions.
Concept testing helps to answer
- What tasks are required to complete a user’s goal?
Tree Testing
Tree testing is a specialized UX research method for assessing how intuitive an information architecture is. In its simplest form, tree testing involves watching users interact with a prototype menu within a controlled setting (i.e., no content or visuals included, only the menu itself).
By prompting users to complete specific tasks by clicking through the menu (ex: Where would you go to find X or do Y), researchers can see how their architecture relates to their user’s mental models. This allows teams to optimize critical structural elements early in the design process, avoiding more expensive updates downstream.
Tree testing helps to answer
- Is our information architecture intuitive?
- Are we using the right labels?
- Where are users getting lost?
- Which sitemap is more effective?
- How can we optimize click depth?
Card Sorting
Card sorting is a fundamental UX research method applied throughout the design process . In essence, card sorting is exactly that: Sorting a stack of cue cards that have words on them into piles that make sense to the sorter. For example, you may have a stack of 30 cards with the names of different foods on them.
If you asked someone to sort them into piles according to their most vs. least favorite items, you would learn more about their preferences than if you simply asked them their favorite foods. This basic card sorting theory can be applied to any situation, and augmenting the prompts and piles lets UX researchers answer a variety of questions about the opportunity.
Card sorting helps to answer
- How do our users think about this domain?
- What items belong together? Apart?
- What navigation will work best?
- Where will they look for this content?
- Which experiences should we prioritize?
Usability Testing
Usability testing is used to assess how user friendly a higher-fidelity prototype is with your target users. Usability tests are typically used later in the design process, before shifting to the Implementation step of the design thinking process. Usability testing is conducted similar to other ux research methods such as Tree Testing or Card Sorting, where users are asked to complete specific tasks within a controlled environment. Because usability testing is performed with fully functional prototypes (or the minimum viable product), UX researchers are able to benchmark quantitative metrics such as Time to Completion (TTC) in addition to other qualitative metrics. This makes usability testing a powerful tool for demonstrating business impact and deciding what areas to work on in future updates.
Usability testing helps to answer
- How user friendly is our solution?
- How much time/effort does our solution save?
- What impact can we expect our solution to have?
- What should we focus on in the next release?
So what are UX research methods?
UX Research methods describe the established protocols and best practices designed to help teams understand users and improve real experiences . They range from simple surveys to rich ethnographic field studies, and furnish teams with the actionable insights they need throughout the development process.
While UX research methods were once confined to specialized labs, the rise of cloud-based solutions has dramatically simplified the methodologies and reduced the overhead. Today, teams of all sizes can leverage UX Research methods to improve their solutions
UX Research Methods
- Describes set of research protocols and best practices
- Used to study both users, situations and solutions
- Output quantitative or qualitative data
- Helps develop personas and optimize prototypes
- Support end-to-end Design Thinking process
- Major methods include User Interviews, Usability Testing, Card Sorting, Surveys and Behavioral Analytics
The Step-by-Step Guide to UX Competitive Analysis
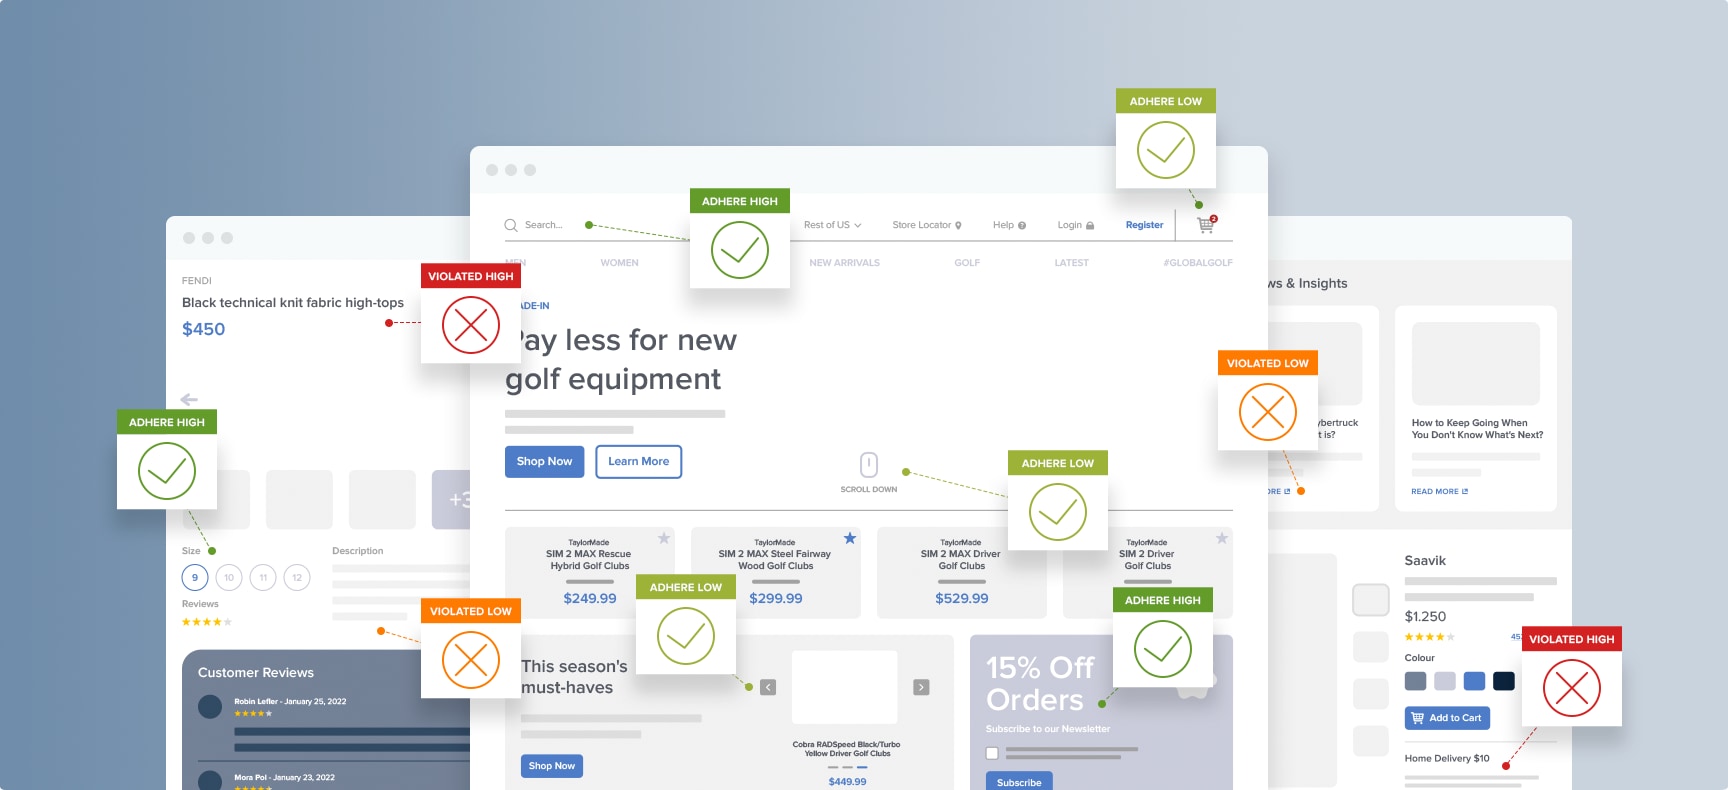
One of the best ways to learn about the competitive landscape for your website is by conducting a UX competitive analysis.
In e-commerce, the biggest players have entire teams of UX designers and developers working to outperform the competition and provide seamless user experiences.
To ensure success, it’s important to compare your site’s UX with competitors, even if you don’t have the same resources.
A UX competitive analysis can help you discover:
- What user experiences are standard in your market
- Actionable insights for improving conversions
- Opportunities to innovate within your own website’s user experience
- What you’re doing right (and what to avoid) in your UX design
In this article, you’ll learn what UX competitive analysis is and the benefits of conducting this type of research. Then we’ll walk through some methods of evaluating your competitors’ UX and deciding what to do with the results of your analysis.
What Is UX Competitive Analysis?
UX competitive analysis is the process of researching major competitors to gain insight into their UX performance. The goal is to improve your product’s UX design by examining specific elements and features in competing products, looking for opportunities to better serve users, avoid common usability issues, and provide a competitive UX.
No matter what kind of product you’re creating or refining, understanding the landscape of solutions that are already available on the market establishes a strong foundation for your work.
Performing a competitive analysis is one of the first steps in the UX design process . Before starting work on a new website, it’s critical that you know what your competitors are doing. Since new players in the market can emerge at any time, and existing competitors continually make design changes, it’s a good idea to make competitive analysis an ongoing, iterative process.
Why Should You Perform a UX Competitive Analysis?
Understanding the advantages and disadvantages of your competitors' UX can help you design a superior user experience that outperforms others on the market, builds brand loyalty, and boosts conversions.
Here are a few of the specific benefits of analyzing the UX of your competitors.
Find Market Gaps
During your analysis, you may discover a need for features your competitors’ websites don’t include. Understanding these market gaps might help you identify features you could build into your own UX design.
For example, you may discover that not all types of users you want to target are being served well with your available features, such as filtering options, checkout flow, or accessibility .
Understand the Strengths and Weaknesses of Your Competition
When you look at the user experience provided by your direct competitors, it gives you insights into their design features, user journeys, and the feelings evoked by their UX designs.
Are there competitors that offer a particularly good user experience example ? If so, why? It could be that your competitor has figured out an innovative way to solve a problem, or they’ve implemented a new feature that provides a more intuitive or delightful experience.
You will also discover the weak spots in your competitors’ UX designs. If there are sites in your market that offer a poor user experience, figuring out why can help you understand what not to do with your own website.
Identify the Advantages and Disadvantages of Your UX Design
As you evaluate competing websites against your own, you will discover the advantages and disadvantages of your design choices.
Understanding what you’re doing well — and what you’re not doing well — compared to your competition can help you build an action plan for improving your UX.
Collect Evidence to Back Up Design Changes
The data you collect from your UX competitive analysis gives you clear evidence for your design decisions. Instead of taking chances when you make changes, you can move forward with an evidence-based approach and present to stakeholders with confidence.
Insight to Solve Usability Issues
If you’ve been struggling with UX issues and are unsure how to solve them, analyzing your competitors can give you new ideas for solving the problems and providing a better experience for your customers.
Free Report: 7 Quick UX Fixes for Your E-Commerce Site
Get a curated selection of e-commerce best practices from our 130,000+ hours of research.
Instantly get the report plus Baymard’s UX research insights by email
A Full-Site UX Audit with Competitive Analysis
A comprehensive UX site audit can provide the same data you would uncover in a UX competitive analysis. Many audits include benchmarking, comparing your site’s user experience to industry standards and competitors.
Baymard Institute’s E-Commerce UX Audit service provides an in-depth UX review of your entire site – including competitive analysis. Our prioritized recommendations are based on findings from 78,000+ hours of user experience (UX) research.
We’ll compare your site’s UX performance to 123 top-grossing e-commerce sites in the U.S. and Europe. With an optional customization, we’ll confidentially evaluate any direct competitors you’d like and report on how your site's UX performance stacks up.
Now let’s take a look at the process of conducting your own UX competitive analysis.
5 Steps to Performing a UX Competitive Analysis for E-Commerce Sites
If you would like to conduct your own UX competitive analysis, Baymard’s research is designed to provide actionable insights to evaluate and improve your site’s UX.
You don’t need a site audit to take advantage of the benchmarking data, review tools, and UX guidelines in Baymard Premium to compare your site to leaders in your market.
We also regularly review outstanding e-commerce UX performance on our blog, diving into industry-specific case studies and guidelines like Office Depot’s “order review” UX .
Regardless of the research and comparison methods you choose, here are the steps to follow when designing and conducting a UX competitive analysis for your site.
1. Outline Your Goals
Think about what you would like to accomplish with your competitive analysis. Common goals might include prioritizing UX improvements, setting the direction for a redesign, or discovering market gaps.
Once you have a clear goal in mind, the rest of the steps involved will follow naturally and help maintain a manageable scope of research and integration.
2. Identify Competitors
Create a list of the competitors you want to include in your evaluation. It’s a good idea to start with 5 to 10 competitors in your space, so you can get useful data with a manageable scope.
Consider including direct and indirect competitors on your list. New competitors may pop up at any time, so make sure to update your list in your next iterative UX competitive analysis.
Direct competitors are the websites that already do what you do. They serve the same customers and offer the same product or services your company does.
For example, if you’re in the online grocery market, your direct competitors are other sites with a grocery UX design. Knowing what they’re doing wrong and right will provide insight into how you can better meet the unique needs and behaviors of users buying groceries online and avoid the common UX pitfalls of grocery e-commerce sites .
**Indirect competitors **are websites that offer something similar to what you offer.
For example, an online luxury retailer might only have a handful of competitors when it comes to products. However, they can create a superior shopping experience by looking at luxury e-commerce sites that target the same demographic, regardless of product.
3. Define Your Parameters
UX covers every interaction users have on your site, from the second they arrive to the second they leave. To get the most actionable results, narrow down your focus to the elements most relevant to the goals of your analysis.
Identify what you want to compare as you evaluate your competitors. For example, your site may want to reduce cart abandonment rates or focus on checkout optimization .
You could use the six broad categories of page types we feature in our e-commerce design examples page. Those categories are:
- Homepage and Category pages
- On-site search
- Product Lists and Filtering
- Product Pages
- Cart and Checkout
- Account and Self-Service
A smaller analysis might cover just one of those categories. You may also decide on different parameters, depending on your company or team’s goals and needs.
4. Conduct Usability Testing and Research
This is the step in which you gather the UX research data for your analysis, identifying the differences between your competitors’ sites and your own. There are a few ways to get the data, and the method you choose will depend on the goals, parameters, and resources available for your project.
Here are three primary ways to gather data for your analysis:
Usability testing : If you have the resources and expertise, you can gather your own primary data through usability testing on your site and your competitors. Usability testing involves directly observing real or representative users interacting with the sites and recording their experiences and reactions.
UX Audit : If you’d like expert help with your analysis, our comprehensive e-commerce UX audit service will provide all the data you need and an action plan for implementation.
The audit includes 7 detailed UX scorecards with a total of 500+ UX performance scoring parameters, used for direct UX performance comparison against competitors among the 123 top-grossing U.S. and European e-commerce sites.
With an optional customization, we will confidentially audit any direct competitors you specify.
- UX Research : Consider Baymard Premium as a comprehensive source of UX research for your competitive analysis. You can use the research guidelines and review tools to self-audit your website and any competitors. Private Q&A sessions with experienced UX researchers are included to help you navigate the research and apply it to your UX priorities.
Regardless of the method you use in this step, be sure to include the mobile version of your competitors’ sites, as well.
5. Summarize and Present Your Findings
Once you’ve completed your evaluation, summarize your findings and present them to the stakeholders. Whenever possible, use visual elements in your competitive analysis summary to make your report easy to understand and take action on.
A UX audit typically comes with a report and recommendations to help you focus on the most important design changes for your goals ( Baymard Institute’s E-Commerce UX Audits include a 120+ page report and access to researchers for follow-up questions ).
UX optimization is a multi-step process with a wide scope. It’s important to prioritize your goals to avoid getting overwhelmed. Keep in mind that UX is an ongoing, incremental process that even the highest performing sites are continually working on.
Prioritizing UX Design Changes After Competitive Analysis
Now that you’ve completed your competitive analysis, what’s the best way to identify the most pressing usability issues and opportunities so that you can shape your design strategy?
If you’re creating your own action plan, here are a few popular frameworks you can use to prioritize UX design changes:
SWOT is a strategic planning process based on four categories: strengths, weaknesses, opportunities, and threats. The strengths and weaknesses in a SWOT analysis are internal factors, while threats and opportunities are external factors.
A prioritization matrix is used to compare options, with the goal of ranking your choice based on predefined selection criteria. There are several types of prioritization matrices, from the simple to the complicated, but overall this method can be an effective and efficient way to select the projects your teams should focus on.
Porter’s Five Forces is a UX competitive analysis tool that evaluates competitors based on five elements: buyers, suppliers, substitutes, competitive rivalry, and new entrants. These are the key elements that illustrate your e-commerce website’s competition in the marketplace.
A perceptual map is a visual representation of your customers’ perceptions of your e-commerce website relative to your competition. This kind of map (also called a position map) is set against two axes that move from low to high to assess factors like price vs. performance.
Work with UX Competitive Analysis Experts
With the steps we’ve outlined in this article, you can uncover a lot of information about how your site’s UX performance compares to the competition. If you want to benefit from the experience of a team of UX researchers focused solely on UX for e-commerce, we’re here to help.
Baymard’s e-commerce UX audit services are most commonly used by:
- Sites that would like to benchmark their UX performance to see how they stack up against major competitors
- Sites that need inspiration and verification for a redesign
- Optimized e-commerce sites that need external and unbiased assessment to identify final tweaks and improvements
- Agencies, designers, and tech vendors that want reassurance they’re on the right track with their clients’ e-commerce design
Email [email protected] to learn more about your goals and Baymard’s UX research methodology.
8 methods of UX analysis

October 20, 2016 ...
- User Research & Testing
- UX/UI Design

Use a Multidimensional Perspective to Inform Design Strategy
User-centered design focuses on satisfying the end needs of users.
Data – both quantitative and qualitative – informs decision-making for design direction. Understanding what the data is telling you impacts your information architecture , personas, user flows, interface design, and a variety of other aspects of the user experience.
Having multiple dimensions of data allows companies to innovate, and having a multidimensional strategy requires looking at a design challenge from different angles. Our 8 Methods of UX Analysis methods fall into four categories – the User Perspective, the Business Perspective, the Expert Perspective, and the Technical Perspective. Each offers a unique vantage point, allowing you to feed your design process with real insight.

8 Methods of UX Analysis
1. website and device analytics.

It’s crucial to understand where your target demographic “lives.” What is their preferred digital environment? Technology changes constantly, and your users’ behaviors and preferences will change as well.
Device and Website Analytics reveal important information about click paths, target demographics, device preferences, and core browsers and technology.
Example: Analytics Provide Insight
Flurry Analytics is one tool we use to analyze user behavior in mobile devices. In the example below, we tracked how users progressed through a mobile application. When compared with a different version of the mobile app, we were able to see that the preferred version had only a 7% bounce rate, compared to a 23.5% bounce rate for the other version that showed a full-screen advertisement.

2. Business and Sales Analytics

Understanding business and sales data is an important part of UX as well. What strategic moves are yielding the most value? Which can be reconsidered?
Business and sales analytics allow companies to measure their success and evaluate how to improve concretely.
Example: Sales Data Reveals Key Demographics
Business and sales data reveals important information about your product and users. Even though web statistics showed a more balanced demographic, one client’s sales data revealed that they had a predominantly older female user base actually purchasing. This data, illustrated below, was important to consider when it came to brand redesign.

3. Competitor Benchmarking

Competitor Benchmarking will surface opportunities for improvement or differentiation. It also indicates areas of strength.
By exploring qualitative data (observations, discussion of trends, etc.) and quantitative data (concrete numbers and statistics supporting the qualitative assessment) the team can make recommendations to meet – and ideally surpass –the moves being made by the competition.
Example: Analyzing Usability
The Competitor Benchmark below analyzed the number of “steps to checkout” of similar e-commerce sites.
After conducting benchmark analysis, we analyzed how to keep the steps simpler and shorter to reduce dropout.

4. UX Principles Benchmarking

Timeless principles exist for a reason – in many cases, they’ve been proven to enhance products.
UX Principles Benchmarking evaluates the website or product against principles – and myths – and uses them as a metric to identify how to improve the design. Principles and myths are indicative of what works and what doesn’t. They act as a litmus test for what constitutes sound design.
Example: Benchmarking Against Specific Principles
An example principle is that “ scrolling is faster than paging .” Each time a user clicks to a new page (called “paging”), there’s an average 6.5 second refresh time. A user can scroll one long page (made up of multiple page sections) in a matter of seconds, versus spending a ton of valuable time transitioning between pages (e.g. spending 26 seconds viewing 4 pages).
Using this principle as a benchmark, we’d provide recommendations for how a client could make their website more scrollable and scannable.

5. UX Checklists and Heuristics

At Fresh, we use both a 150-point checklist across 10 categories and multiple heuristic frameworks used to analyze whether or not websites are high-end. These expert reviews serve to evaluate, concretely, how to improve a design.
Examples of key elements analyzed include whether content is current, whether included advertisements are professional and relevant, and whether branding is consistent throughout the site.
Example: A Framework for High-End Websites
Below is our 7 Ingredients for High-End Experiences heuristic framework . It’s one of our tools for inspecting and summarizing different aspects of a website’s performance.

6. UX Trends Evaluation

A UX Trends Evaluation identifies new directions in the field of UX and assesses whether or not your product could benefit from more cutting-edge design work.
Innovation is exciting. However, in user-centered design, it’s important to focus first and foremost on the end needs of the people using your product. While UX is expanding in new, innovative directions, analysis should also prioritize your target users and their needs, matching them with trends that fit.
Example: Large Screen Sizes and Higher Resolutions are Trending
In addition to mobile screen sizes, people are using larger screens with higher levels of resolution to access websites. Without designing with these habits in mind, your experience might look and feel low-end. The fact that screens are becoming increasingly larger, with higher resolutions, is important to analyze and account for.

7. Technical Analysis

Which integrations are easy to make? What constraints and limitations need to be accounted for? Maximizing design efficiency comes from understanding the consequences of design decisions as you understand and leverage the technology.
Tech Stack Constraints – Which aspects of your tech stack will make your site most efficient?
Performance Constraints – Will the design slow down performance?
Integration Constraints – What systems can your website be integrated with to increase performance?
Back-end CMS/Admin Constraints – What is the right content management systems to make maintenance of your site easiest?
Example: Choosing the Right Tech Stack
We built Washington Federal’s website on the Microsoft stack after understanding their technical requirements. By understanding the CMS system constraints, we were still able to build a highly customized design and leverage the right CMS plugins to help development move faster.

8. Process Analysis

Analyzing the process a user goes through in using a system allows you to paint a picture of the challenge before designing a solution.
Understand the Challenge and Design with Empathy – Improving a process or system requires understanding how it works for users.
Think Through Flow and Focus – The core of a web or mobile application is its user flow. Asking stakeholders and users if it makes sense aligns the experience to their needs.
See the Big Picture – Thinking at a high level takes you out of the granular details of a design (e.g. the layout of data entry fields) and helps you think broadly about what users are trying to do and how you can help them accomplish their goal.
Consolidate, Separate, or Reduce Processes – Documenting processes and steps a user goes through allows you to identify which steps should be consolidated and which should be broken apart. A system that consolidates the information automatically will be more user friendly.
Download our UI/UX Design Process Infographic!
Example: Process Analysis in the Healthcare Domain
One of our clients in the healthcare industry approached us about building a CRM tool to manage their benefits administration. Process Analysis enabled us to answer how to create a minimum viable product that made their core processes more efficient.

Data – both quantitative and qualitative – tells a story about what is working for users, stakeholders, and businesses.
Ultimately, analysis adds clarity and serves as a justification to make important decisions with confidence. As opposed to making design decisions that don’t have evidence or justification could come across haphazard, UX Analysis provides the multidimensional perspective to take your design strategy from acceptable to exceptional.
Because data drives insights that drive strategy that results in more meaningful user and customer experiences, there is value and ROI in including analysis in your design process.
Get our latest articles, tips, and resources delivered right to your inbox
- By submitting this form, you agree to Fresh Consulting’s Privacy Policy
You may also like

Manufacturing automation project guidelines for success

Innovation as a Service
Medical Device Engineering and Cross-Disciplinary Collaboration

AI/Machine Learning
The Power of Artificial Intelligence in Fintech
Other related insights.

Enterprise Systems for Technology Companies

White Papers
A Holistic Approach to Websites

Design + Agile Mindset

UX Trends for 2017

UI/UX Principle #45: Addition by Subtraction

UI/UX Principle #4: Responsive Design Isn’t Enough

Home > Blog >
Transcription in qualitative research: a comprehensive guide for ux researchers, theertha raj.
August 15, 2024
As a UX researcher, you're likely familiar with the importance of gathering qualitative data through interviews, focus groups, and observational studies. But what happens after you've collected all that valuable audio or video content? That's where transcription for qualitative research comes into play.
In this article, we'll dive deep into the world of transcription, exploring its importance, types, and best practices for UX researchers.
What is transcription in qualitative research?
Transcription in qualitative research is the process of converting spoken words or recorded audio into written text.
This crucial step allows researchers to analyze, code, and interpret the data collected during interviews, focus groups, or other qualitative research methods.
This written format makes it easier to review, share, and analyze the data, ultimately leading to more informed design choices and improved user experiences.
What are the 4 types of transcription?
When it comes to transcription qualitative research, there are four main types that researchers should be aware of:
- Verbatim transcription: This type captures every utterance, including filler words, false starts, and non-verbal sounds. It's the most detailed form of transcription and is often used when analyzing speech patterns or conducting linguistic studies.
- Intelligent verbatim transcription: Also known as "clean verbatim," this type removes filler words and false starts while maintaining the essence of the conversation. It's more readable than strict verbatim transcription and is commonly used in qualitative research.
- This type focuses on capturing the main ideas and content of the conversation while cleaning up grammar and removing unnecessary repetitions. It's useful when the primary goal is to understand the content rather than analyze speech patterns.
- This specialized type uses phonetic symbols to represent the sounds of speech. It's primarily used in linguistic research and is less common in UX research contexts.
What type of transcription is used in qualitative research?
In qualitative research, intelligent verbatim transcription is often the preferred choice . This type of transcription strikes a balance between capturing the essence of the conversation and maintaining readability. It preserves the interviewee's words and intent while removing unnecessary filler words and false starts that can distract from the main content.
This type of transcription in qualitative research makes it easier to identify key themes, pain points, and user needs that can inform design decisions.
What type of transcription is used in thematic analysis?
Thematic analysis , a common method used in qualitative research to identify patterns and themes within data, typically relies on intelligent verbatim transcription . It provides enough detail to capture the nuances of participants' responses while maintaining readability, making it ideal for identifying recurring themes and concepts.
What is the average price for transcription services?
The cost of transcription services for qualitative research can vary widely depending on factors such as turnaround time, audio quality, and the level of detail required. On average, professional qualitative transcription services may charge anywhere from $1 to $3 per audio minute for standard turnaround times (typically 3-5 business days).
For UX researchers working on time-sensitive projects, expedited services are available but often come at a premium, with prices potentially doubling or tripling.
It's worth noting that some of the best transcription services for qualitative research offer discounts for bulk orders or ongoing projects, which can be beneficial for researchers conducting multiple interviews or focus groups.
When considering the cost, it's important to weigh the value of professional qualitative research transcription services against the time and effort required to transcribe in-house. While DIY transcription might seem cost-effective, it can be time-consuming and may not yield the same level of accuracy as professional services.
How to write a transcript for qualitative research
Writing a transcript for qualitative research involves more than just typing out what you hear.
Here are some key steps to ensure your transcripts are accurate, useful, and ready for analysis:
- Prepare your tools: Choose reliable transcription software for qualitative research or a word processing program. Ensure you have a good quality audio playback device and headphones for clear listening.
- Listen to the entire recording: Before you start transcribing, listen to the entire recording to familiarize yourself with the content, speakers, and any potential audio issues.
- Create a template: Set up a consistent format for your transcripts, including headers for participant information, date, time, and any other relevant details.
- Transcribe the content: Begin typing out the conversation, following the intelligent verbatim method unless your research requires a different approach. Include speaker labels to differentiate between the interviewer and participant(s).
- Add time stamps: Regularly insert timestamps throughout the transcript. This helps in referencing specific parts of the conversation later and syncing the transcript with the original audio if needed.
- Note non-verbal cues: When relevant, include descriptions of significant non-verbal communication or environmental factors in square brackets, e.g., [laughs], [long pause], [background noise].
- Review and edit: Once you've completed the initial transcription, review it while listening to the audio again. Correct any errors and ensure the transcript accurately represents the conversation.
- Format for readability: Use paragraphs to separate distinct topics or questions. While it's best to keep bullet points and lists to a minimum, you can use them sparingly to highlight key points if necessary.
How do you transcribe audio data in qualitative research?
Transcribing audio data in qualitative research is a process that requires careful consideration of several factors.
What are the aims of the research project?
Before you begin transcribing, it's crucial to clearly understand the goals of your research project . Are you looking to gather specific user feedback on a product feature? Or are you conducting a broader study on user behavior and preferences? The aims of your project will influence the level of detail and focus required in your transcriptions.
For example, if you're researching user reactions to a new app interface, you might pay special attention to comments about the layout, navigation, and visual elements. On the other hand, if you're exploring user motivations and decision-making processes, you might focus more on capturing the reasoning and emotions behind their responses.
What level of detail is required?
The level of detail in your transcriptions should align with your research goals and analysis methods. For most UX research projects, intelligent verbatim transcription provides an ideal balance of detail and readability. However, there may be instances where more or less detail is necessary.
If you're conducting a usability test and need to capture specific user actions along with their verbal feedback, you might include more detailed notes about their interactions with the product. Conversely, if you're more interested in high-level themes and general user sentiment, a slightly less detailed transcription might suffice.
Who should do the transcribing?
Deciding who should handle the transcription is an important consideration. You have several options:
- DIY transcription: As the researcher, you might choose to transcribe the audio yourself. This can be time-consuming but allows you to immerse yourself in the data and potentially identify themes early on.
- Team member transcription: Assigning transcription tasks to other team members can distribute the workload and provide multiple perspectives on the data.
- Professional transcription services: Opting for qualitative research transcription services can save time and ensure high-quality, accurate transcripts. Many services specialize in research transcription and understand the specific needs of qualitative researchers.
- Transcription software: Using qualitative research transcription software can speed up the process, especially for clear audio recordings. However, it's important to review and edit machine-generated transcripts for accuracy.
What contextual detail is necessary to interpret data?
Context is crucial in qualitative research, and your transcripts should include relevant contextual details that aid in interpreting the data. This might include:
- Background information about the participant (e.g., age range, profession, relevant experience)
- The setting of the interview or focus group
- Any visual aids or prototypes used during the session
- Significant non-verbal cues or reactions
How should data be represented?
When it comes to representing data in your transcripts, clarity and consistency are key. Use a clear, consistent format for speaker labels (e.g., "Interviewer:", "Participant 1:"). Include time stamps at regular intervals or at the beginning of new topics. Consider using bold or italics to highlight key quotes or themes, but use this sparingly to maintain readability.
What is an example of a transcription?
Here’s an example of what an AI-generated transcript looks like, with time-stamps and Speaker labels. The transcript also features text highlighted in green for positive responses, and blue for questions.

Best Automated Transcription Services for Qualitative Research
When conducting qualitative research, choosing the right transcription service is crucial for efficient data analysis. Here's a comparison of some popular transcription tools used in qualitative research:
NVivo is primarily a qualitative data analysis tool that offers transcription services as part of its feature set.
Price: NVivo's pricing is on the higher end, with users required to purchase blocks of transcription time (e.g., €80 for 10 hours).
- NVivo allows uploading of various audio and video file formats to its online platform.
- Allows you to edit and make changes, tag speakers, and ensure proper formatting
- Offers encrypted and secure storage, adhering to HIPAA standards and GDPR compliance
Languages Supported: NVivo supports transcription in 42 languages.
Time taken: Specific time is not mentioned, but it's noted to be generally slower compared to other tools.
Accuracy: NVivo's transcription accuracy is lower compared to competitors, especially in noisy environments and with accents.
How much does NVivo transcription cost?
NVivo transcription costs around €80 for 10 hours of transcription time. The pricing structure is based on purchasing blocks of time rather than a subscription model.
Is NVivo transcription free?
No, NVivo transcription is not free. It requires purchasing transcription time.
Is NVivo good at transcription?
NVivo's transcription capabilities are considered less accurate compared to some competitors, especially in challenging audio conditions or with accented speech.
Is NVivo used for qualitative research?
Yes, NVivo is widely used for qualitative research, primarily as a data analysis tool. Its transcription feature is an additional service within this broader qualitative research platform.
Dovetail is a comprehensive research repository that includes transcription, coding, and data analysis features.
Price: Dovetail offers a free plan with 1 project per month, while paid plans start at $29 per user per month.
- Does automated transcription of video and audio recordings
- Does sentiment analysis of transcripts with highlights for positive and negative responses
- Also offers built-in analysis tools for coding and tagging of transcripts
Languages Supported: Supports 41 languages, including Japanese, Finnish, Hindi, and Malay.
Time taken: Transcription is completed within minutes.
Accuracy: While generally considered accurate, specific accuracy metrics are not provided.
Looppanel is an AI-powered research repository tool that can do extremely accurate interview transcription for UX research, among other cool features. It’s special compared to other transcription services on this list, as it also lets you record your calls directly, and receive high-quality transcripts within mere minutes.
Price: Paid plans start at $30 per month, with a 15-day free trial available.
Features:
- Collaboratively take notes with colleagues during your user interviews
- Save key time-stamps of important quotes as they come up
- Sentiment analysis of transcripts with highlights for questions, positive and negative responses
- Generate AI-powered notes from your transcript for you, with a dedicated analysis space where you can see all your data by question or tags
- Do Google-like search within your research repository to find any quote or data point you need, in minutes.
Languages Supported: Supports 8 languages, including English, Spanish, French, German, Italian, Portuguese, Dutch, and Hindi.
Time taken: Provides near-instant transcripts for recorded calls.
Accuracy: Looppanel boasts over 90% accuracy in transcription.
MAXQDA is a research analysis tool that’s more complex than the others, but is ideal for academics and scientists who need deep, detailed analysis. MAXQDA offers transcription services alongside qualitative analysis tools.
Price: Approximately $20 for 2 hours of transcription, with varying plans based on industry and use case.
- MAXQDA offers a customizable dictionary for accuracy
- Does automatic speaker detection, and timestamps.
- It's GDPR-compliant
- Doesn't require a subscription or MAXQDA license for transcription services.
Languages Supported: Supports over 48 languages.
Time taken: Transcription is completed within minutes.
Accuracy: Claims over 90% accuracy
Otter.ai is a transcription tool that doesn’t offer any in-app analysis features, unlike the other tools on this list.
Price: Offers a free tier with 300 minutes of transcription; paid plans start at $8.33 per month.
Features:
- Otter.ai can record and transcribe meetings on various platforms in real-time, capture slides, and generate summaries
- It also allows for YouTube video transcription
- Exports to various file formats.
Languages Supported: Only English
Time taken: Within minutes
Accuracy: Generally high accuracy, especially in structured meeting environments.
Challenges in transcription
Transcription in qualitative research can face several challenges:
- Audio quality issues
- Multiple speakers or overlapping speech
- Accents or dialects
- Background noise
- Jargon or specialized terminology
- Time-consuming nature of manual transcription
- Maintaining consistency across multiple transcripts
Best Practices for Transcription in Action
How to do it:
- Use high-quality recording equipment
- Conduct interviews in quiet environments when possible
- Consider using a foot pedal for manual transcription to improve efficiency
- Use transcription software or services for larger projects
What to include:
Speaker identification, time stamps, non-verbal cues (laughter, pauses, sighs), contextual information and consistent formatting
How to record for optimal use in your study:
- Test your recording equipment before the interview
- Use external microphones for better audio quality
- Inform participants about the recording
- Take brief notes during the interview to supplement the recording
- Back up your recordings immediately after the interview
What is the difference between transcription and translation in qualitative research?
Transcription involves converting spoken language into written text in the same language, while translation involves converting text from one language to another. In qualitative research, transcription is typically done first, followed by translation if the research is conducted in a language different from the one used for analysis.
What are the different types of transcription process?
The main types of transcription processes are:
1. Verbatim transcription (including all utterances and sounds) 2. Intelligent verbatim (removing fillers and false starts) 3. Edited transcription (cleaning up grammar and removing repetitions) 4. Phonetic transcription (using phonetic symbols to represent sounds)
What transcription services for qualitative data?
Transcription services for qualitative data include automated tools like NVivo, Dovetail, Looppanel, MAXQDA, and Otter.ai, as well as human transcription services. The choice depends on factors such as budget, accuracy requirements, and the complexity of the audio data.
Can I use NVivo for transcription?
Yes, you can use NVivo for transcription. However, it's important to note that while NVivo offers transcription services, it may not be as accurate or cost-effective as some alternatives, especially for large-scale projects or challenging audio conditions.
What is the alternative to NVivo transcription?
Alternatives to NVivo transcription include Dovetail, Looppanel, MAXQDA, and Otter.ai, each offering different features and pricing structures.
Is NVivo transcription worth it?
The value of NVivo transcription depends on your specific needs. While it integrates well with NVivo's analysis tools, its lower accuracy and higher price point may make it less appealing for some researchers.
Follow us on
Get the best resources for ux research, in your inbox, related articles.

Resources & Guides
How to Transcribe Interviews for UX Research

Best Transcription Services for Market Research
.png)
June 8, 2023
The Best Transcription Services for User Research
Looppanel automatically records your calls, transcribes them, and centralizes all your research data in one place
What is secondary analysis? A comprehensive overview
Last updated
16 August 2024
Reviewed by
Miroslav Damyanov
Within your projects and initiatives, you can leverage secondary analysis, like case studies, census data, or past clinical trials, to accelerate growth and innovation. But there’s more to understand when peeling back this onion.
Building on the idea of leveraging existing work, we’ll provide a comprehensive overview of what secondary analysis really is, including its applications in various fields and its advantages and disadvantages. You’ll also discover the most effective ways to incorporate it into your projects.
- What is secondary data analysis?
Secondary analysis is any form of research that relies on or uses previously conducted research for the purposes of a new study. If existing data is cited or previously conducted studies help to achieve a new outcome, it’s secondary analysis.
It happens quite often, especially when researchers use quantitative or qualitative data that has been gathered previously and analyze it in a new way. The secondary data in these instances is often published or made available publicly with permission to cite and use it
- Why is secondary data analysis important?
Secondary data analysis is important for innovation. It can serve as a historical reference to studies of yesterday.
This kind of previously summarized data, usually written by other parties, can be great for reaffirming a similar result or finding you may have. It’s also where you can find commentary or analysis of the steps taken before you’re on the scene.
Secondary analysis is important because it can accelerate your research by providing reliable springboards from previous research. This allows you to pick up where someone else left off in the field.
Imagine you’re studying a local population or community demographic. In this case, turning to the latest census data will be more useful than conducting your own headcount. Even simpler: if you’re making a cake from scratch, it’s a good thing you don’t have to churn your own butter to complete the recipe. You get the idea. But there’s more to secondary analysis than just census and cake.
- Types of secondary research
Imagine all the libraries of studies and the internet’s access to peer reviews, case studies, statistics, and data. Think about how much data is out there. A lot! However, it won’t all be useful in your studies or projects. This is why it’s best to understand the categories and types of secondary research. From there, you can narrow your focus to the data and research that best applies to your work.
Statistical analysis
A collection of thousands of data points is combined with the intention of discovering new insights. And those statistics are applied to every corner of business, government, health, and science.
This type of secondary analysis is great for drawing new insights, testing new hypotheses, and validating new findings. We rely on statistics to help us identify areas of improvement and avoid mistakes every day.
Literature reviews
Think of these as published pieces of information within a particular segment or subject area.
The primary purpose of any literature review is to provide a multifaceted and comprehensive overview of current knowledge, identify gaps, and establish a theoretical framework for further research.
Sometimes, literature reviews are part of a topic within a specific time period. Researchers can present them as an in-depth analysis or just a simple source summary.
Case studies
Case studies are more in-depth analyses of a person, group, or specific event.
In secondary research, you’ll look for existing case study reports, published papers, and documented instances to gather and analyze data. These studies can provide comprehensive insights into specific phenomena, processes, or practices.
Nearly every aspect of the topic is explored, highlighting challenges, solutions, how those solutions are applied, and final outcomes. They can prove or disprove a theory but typically serve as a demonstrative piece of evidence or analysis.
Content analysis
Content analysis is, as it sounds, the study of certain phrases, words, or themes within a body of qualitative data.
This type of secondary analysis provides context so you can analyze particular relationships between words, meanings, or concepts. It’s a type of secondary research that involves examining and interpreting pre-existing material to uncover patterns, trends, and insights.
- Advantages of conducting secondary data analysis
Starting your research from an advanced position of knowledge gives you an advantage. Secondary data analysis presents many benefits, regardless of the topic or information you’re exploring.
Cost-effectiveness
Secondary analytics are cost-effective. Since studies and data already exist, you don’t have to repeat certain tests or steps, alleviating costs without compromising your findings. You’ll gain access to high-level data that might be too cost-prohibitive to perform independently.
It can also be cost-saving in exploratory research. It’s helpful to gain valuable preliminary or exploratory research first to refine your hypothesis before committing to primary data collection.
Time-saving
Someone else may have already invested in the study, producing findings and data you can readily use within your research and saving you time.
Being able to access large datasets, which are typically extensive and robust, provides researchers with a wealth of information that would otherwise be too time-consuming or difficult to gather independently.
Ability to answer additional research questions
Within the scope of your project or research, there will be questions you can’t answer first-hand. Using secondary analysis allows you to answer those additional research questions using pre-existing findings or results.
You can also analyze old longitudinal data and still find new trends, theories, or applications. Enabling longitudinal studies can also help you track changes and trends over time.
- Disadvantages of secondary data analysis
You can’t run your business and projects entirely by piggybacking on secondary data alone. There are some disadvantages to relying solely on analysis that has already been published.
Data quality concerns
You weren’t “there.” You weren’t part of the study or model behind the secondary analysis, so there’s a risk that mistakes were present or findings weren’t entirely accurate. You’ll need to verify that the sources aren’t citing outdated information or presenting original data with bias.
Relevance is another potential issue. Some data might be outdated or not reflective of current conditions, especially in rapidly changing fields or industries. These concerns about data quality could be problematic for your new research project or objective.
Data accessibility
Access to certain secondary data sources may be restricted, require payment, or come with usage limitations. Statista and Deloitte, for example, provide high-quality reports, but some are only accessible after payment.
Also, some academic articles may require a subscription or an account affiliated with a higher education institution.
Need to de-identify information
When you incorporate secondary analysis into your project, you’ll need to remove identifiers from the original source. For example, de-identified patient data won’t have specifics about the patient’s personal information.
- How to carry out secondary data analysis
Follow this simple roadmap for carrying out your own secondary analysis study.
1. Identify and define the research topic
The first step is recognizing the goal of the project or question you’re attempting to answer. Define your research topic in a way that provides clarity for the datasets you’ll need to collect.
2. Find research and existing data sources
Consider which data sources exist that might present the findings you need to help answer your question.
Start digging through reputable sources within relevant timelines to explore what data already exists. These might include academic databases, government records, organizational reports, and online repositories.
3. Begin searching and collecting the existing data
With an idea of what types of secondary analysis will offer the best data for your project, start searching for relevant studies and collect those that might help. Collect several sets of metrics and analyses to inform your analysis.
4. Combine the data and compare the results
When you feel you’ve collected the right studies, you can begin combining your findings and comparing results.
Before you get started, you might have to “clean” the data, handle missing values, or merge datasets from different sources.
Look for trends and common themes or results. Verify if outlier statistics are anomalies or valuable to your study.
5. Analyze your data and explore further
Analyze your collected data through the lens of market research. Look to determine what the data shows, ensure it makes sense, and connect the dots to reach your original goal.
Use appropriate statistical or qualitative analysis methods to examine your data. For you, that might involve descriptive statistics, inferential statistics, or thematic analysis, depending on the nature of the data and your research questions.
- Sources of secondary research
With literally thousands of websites and research at your fingertips, you can find relevant secondary research sources practically anywhere. You might also locate research from both internal and external sources.
Internal data
As a company, you can look for internal secondary data to help you reach the answers you’re looking for. Here are some examples:
Historical sales reporting
Website analytics from previous years
Past employee training and testing results
News articles
Internal conversations
Customer databases
Internal communications records
Financial reports
External data
Look outside your company for similar reports other companies may have already executed. Trust industry-specific sources on the web as well as municipal or non-profit studies that may also lend credibility to your work.
Academic journals, public databases, industry reports, trade publications, and government agencies can all be valuable resources for secondary data. Here are some examples:
Springer Nature
Census.gov/data
Demographics Now
Which is better, primary or secondary analysis?
Most of the best innovations and research initiatives are served by both primary and secondary research analysis.
Don’t look at one or the other. Instead, harness both for the most impactful research. Springboard from the work of others and use secondary research to bridge gaps in your efforts. Then, conduct your primary research to deep dive into those arenas, combining both for the most thorough investigation.
What are some use-case examples of secondary analysis?
Secondary analysis is more common than you might realize. You may have used it before without realizing it.
Here are some use case examples of secondary analysis used across business applications, research and development, learning, healthcare, and more.
A grad student expands on an advisor’s research to contribute to a thesis.
A data analyst uses their own data to run additional reports.
A researcher uses new software to further explore historical reporting.
An entrepreneur studies demographic information to create more effective marketing personas.
A school principal uses nationwide studies to inform curriculum development.
A digital marketing specialist uses site metrics to outline areas of improvement for user experiences.
How can you be sure to remove bias from secondary analysis?
As a researcher, be sure to evaluate the data you source to make sure it’s accurate, timely, and reputable. Before applying any secondary analysis, remove bias by answering the following questions about the source:
What was the secondary study’s original purpose?
Who collected the original data? (credentials)
What data was collected and when?
What were the methods used and dataset limitations at the time?
Should you be using a customer insights hub?
Do you want to discover previous research faster?
Do you share your research findings with others?
Do you analyze research data?
Start for free today, add your research, and get to key insights faster
Editor’s picks
Last updated: 18 April 2023
Last updated: 27 February 2023
Last updated: 5 February 2023
Last updated: 16 April 2023
Last updated: 16 August 2024
Last updated: 9 March 2023
Last updated: 30 April 2024
Last updated: 12 December 2023
Last updated: 11 March 2024
Last updated: 4 July 2024
Last updated: 6 March 2024
Last updated: 5 March 2024
Last updated: 13 May 2024
Latest articles
Related topics, .css-je19u9{-webkit-align-items:flex-end;-webkit-box-align:flex-end;-ms-flex-align:flex-end;align-items:flex-end;display:-webkit-box;display:-webkit-flex;display:-ms-flexbox;display:flex;-webkit-flex-direction:row;-ms-flex-direction:row;flex-direction:row;-webkit-box-flex-wrap:wrap;-webkit-flex-wrap:wrap;-ms-flex-wrap:wrap;flex-wrap:wrap;-webkit-box-pack:center;-ms-flex-pack:center;-webkit-justify-content:center;justify-content:center;row-gap:0;text-align:center;max-width:671px;}@media (max-width: 1079px){.css-je19u9{max-width:400px;}.css-je19u9>span{white-space:pre;}}@media (max-width: 799px){.css-je19u9{max-width:400px;}.css-je19u9>span{white-space:pre;}} decide what to .css-1kiodld{max-height:56px;display:-webkit-box;display:-webkit-flex;display:-ms-flexbox;display:flex;-webkit-align-items:center;-webkit-box-align:center;-ms-flex-align:center;align-items:center;}@media (max-width: 1079px){.css-1kiodld{display:none;}} build next, decide what to build next, log in or sign up.
Get started for free
Qualitative Data Coding of User Experience With an Urban Air Mobility Fleet Manager Interface
- August 2024
- Proceedings of the Human Factors and Ergonomics Society Annual Meeting
- This person is not on ResearchGate, or hasn't claimed this research yet.

Discover the world's research
- 25+ million members
- 160+ million publication pages
- 2.3+ billion citations
No full-text available
To read the full-text of this research, you can request a copy directly from the authors.
- Quang V Dao
- Jeff Homola

- Robert McSwain
- Jacob R. Schaefer

- Jeffrey Homola
- Marcus A Johnson
- Lynne Martin
- Yasmin Arbab
- Joey Mercer
- STRATEG ORGAN

- Recruit researchers
- Join for free
- Login Email Tip: Most researchers use their institutional email address as their ResearchGate login Password Forgot password? Keep me logged in Log in or Continue with Google Welcome back! Please log in. Email · Hint Tip: Most researchers use their institutional email address as their ResearchGate login Password Forgot password? Keep me logged in Log in or Continue with Google No account? Sign up
COMMENTS
Hands-on tips for analyzing data in UX research—with data analysis frameworks, tools for both qualitative and quantitative analysis, and mistakes to avoid.
Discover 11 essential UX research methods to get valuable user insights on user needs, behaviors, and pain points to inform your design process.
UX Research Cheat Sheet. Summary: User research can be done at any point in the design cycle. This list of methods and activities can help you decide which to use when. User-experience research methods are great at producing data and insights, while ongoing activities help get the right things done. Alongside R&D, ongoing UX activities can make ...
When the interviews and observations are done, UX researchers are often left with a mountain of data and only a faint idea of what to do next. This guide to User Research Analysis will walk you through tagging, sorting, and labeling your data to surface relevant themes and insights.
UX research includes two main types: quantitative (statistical data) and qualitative (insights that can be observed but not computed), done through observation techniques, task analysis, and other feedback methodologies. The UX research methods used depend on the type of site, system, or app being developed.
The UX research process, step by step, identifying goals and choosing methods to synthesizing and communicating results.
Research analysis and synthesis—the process of sorting, categorizing, and transforming raw data into valuable information—is one of the most important and challenging steps in the UX research process.
Analysing UX research and synthesising the data that comes from it can play a huge part in the success of your end product. In this piece, we take a look at how analysing UX research will turn your findings into useful insights.
Learn about the main techniques of UX research, their types and their benefits. What is the best research method and how to choose it? Find the best approach for your goals!
A research hypothesis helps guide your UX research with focused predictions you can test and learn from. Here's how to formulate a research hypothesis.
What is qualitative UX research? The goal of qualitative user research is to obtain and analyze non-numerical, subjective information from various kinds of user testing. Data from qualitative user research usually takes the form of quotes, anecdotes, observations, or narrative descriptions and is used to assess how usable a product is.
User experience research sets out to identify the problem that a product or service needs to solve and finds a way to do just that. Research is the first and most important step to optimising user experience. UX researchers do this through interviews, surveys, focus groups, data analysis and reports.
UX research analysis is the key to unlocking your research efforts. It's the process of systematically examining the data you've collected during your research study, whether through user interviews, surveys, usability tests, or other methods. By doing so, you extract valuable insights that guide your design and product decisions and ...
All good UX begins with user research, and it's important to pick the right tools for the job. Here are 10 of the best UX research tools to try in 2023.
Learn how to run a competitive analysis for UX and check out our 6 research methods, so you know what to do what to look at.
Identifying the main themes in data from user studies — such as: interviews, focus groups, diary studies, and field studies — is often done through thematic analysis.
What is UX Research? UX (user experience) research is the systematic study of target users and their requirements, to add realistic contexts and insights to design processes. UX researchers adopt various methods to uncover problems and design opportunities. Doing so, they reveal valuable information which can be fed into the design process.
UX research methods are the family of experimental protocols design teams use to study users and test prototypes. They include everything from simple interviews to specialized scorecards, and can be either moderated (ex. interviews) or unmoderated (ex. surveys). While conducting UX research should generally be left to experienced designers ...
The Step-by-Step Guide to UX Competitive Analysis. One of the best ways to learn about the competitive landscape for your website is by conducting a UX competitive analysis. In e-commerce, the biggest players have entire teams of UX designers and developers working to outperform the competition and provide seamless user experiences.
Our 8 Methods of UX Analysis methods fall into four categories - the User Perspective, the Business Perspective, the Expert Perspective, and the Technical Perspective. Each offers a unique vantage point, allowing you to feed your design process with real insight.
The types of UX research methods. You'll learn about the differences between different kinds of user research methods—quantitative and qualitative, generative and evaluative, attitudinal and behavioral, moderated and unmoderated. Qualitative vs. quantitative research in more depth, including the differences in research design, sampling ...
Explore the best transcription services for qualitative research, comparing top tools like NVivo, Dovetail, and Otter.ai. Learn about qualitative transcription software features, accuracy, and pricing to enhance your research process. Discover tips for effective transcription in qualitative research and overcome common challenges.
Learn about secondary analysis, its importance in research, and how it involves using existing data to draw new conclusions.
An instructional guide to using task analysis in user research, with definitions, pros and cons, tips, examples, and templates.
Qualitative research has gained in importance in the social sciences. General knowledge about qualitative data analysis, how to code qualitative data and decisions concerning related research ...